I researched employees of a corporation from the 1980s and 1990s. All that I had in the database of employees from that period was six CSV files.
I designed the tables to hold data in the CSVs, imported the CSVs into a SQL database, and performed analysis on the data
I first inspected the CSVs and sketched out an ERD of the tables. I used http://www.quickdatabasediagrams.com.
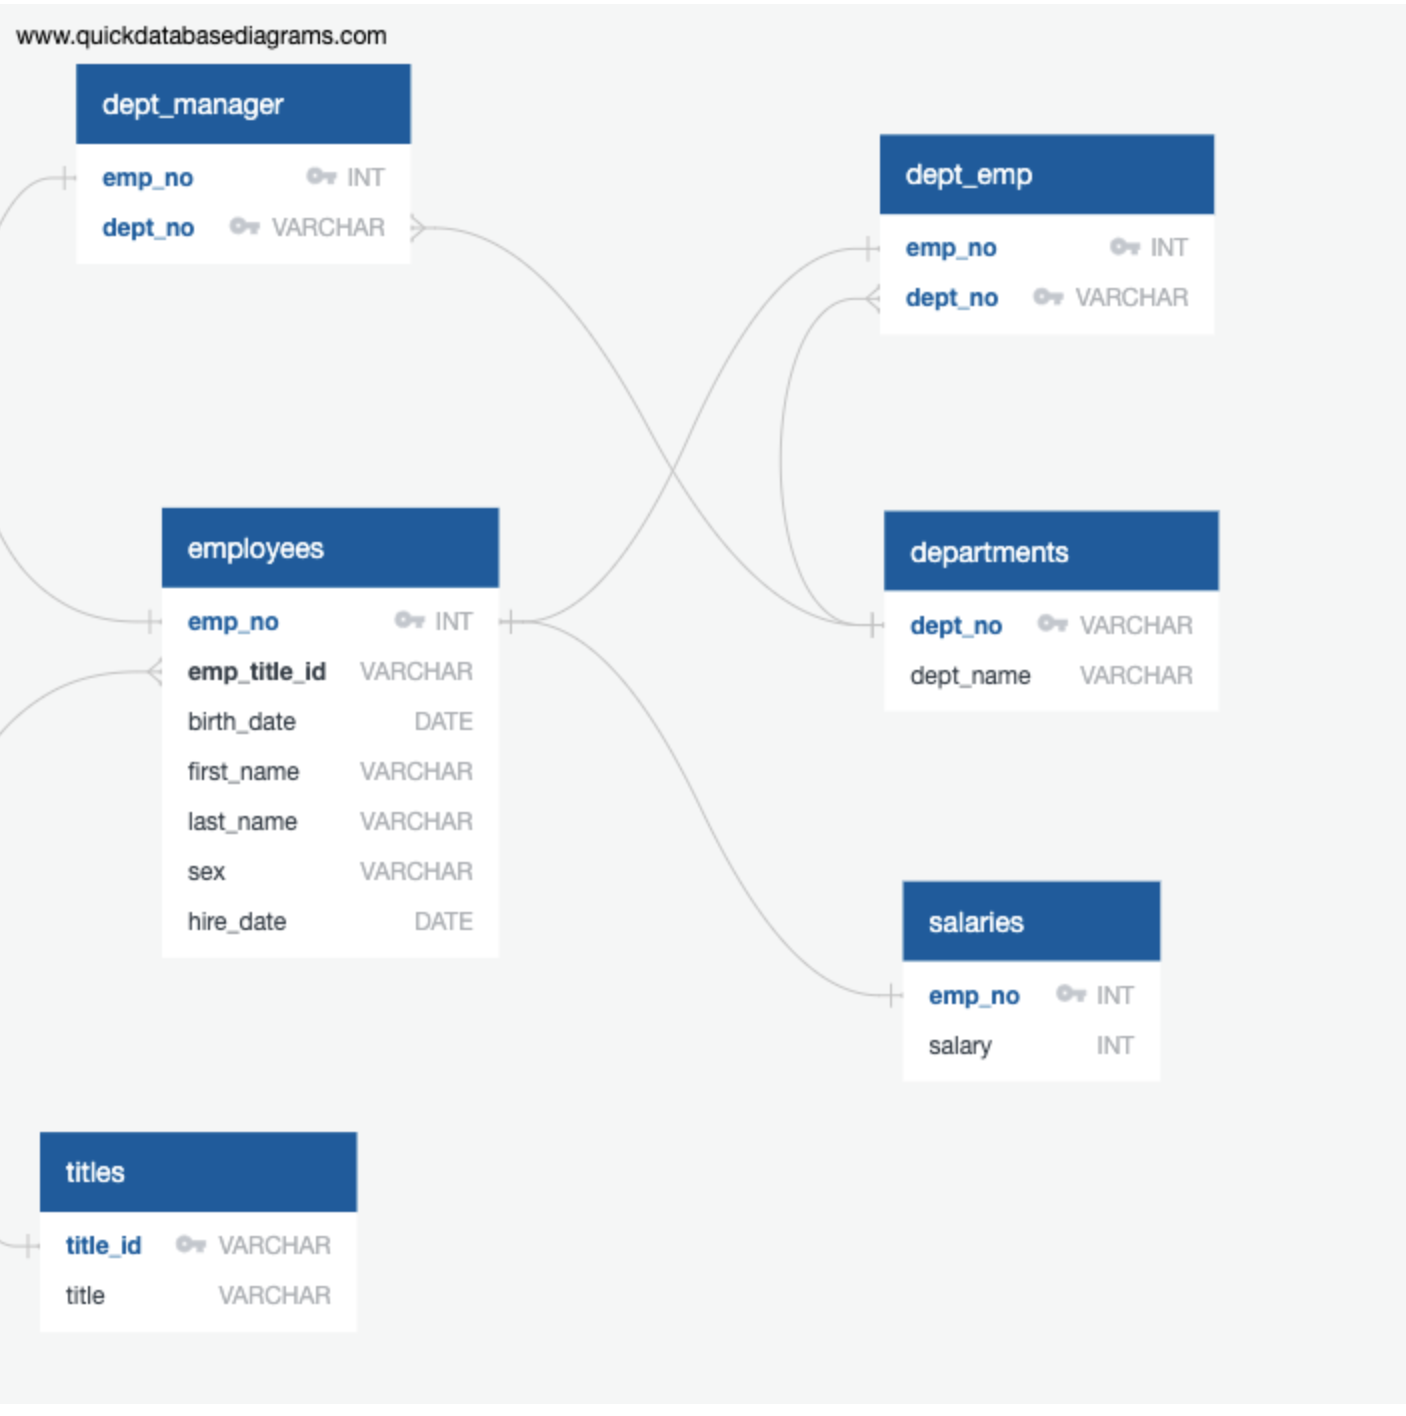
-
I used the information I had to create a table schema for each of the six CSV files
-
I then imported each CSV file into the corresponding SQL table
Once I had my complete database, I did the following:
-
Listed the following details of each employee: employee number, last name, first name, sex, and salary
-
Listed first name, last name, and hire date for employees who were hired in 1986
-
Listed the manager of each department with the following information: department number, department name, the manager's employee number, last name, first name
-
Listed the department of each employee with the following information: employee number, last name, first name, and department name
-
Listed first name, last name, and sex for employees whose first name is "Hercules" and last names begin with "B"
-
Listed all employees in the Sales department, including their employee number, last name, first name, and department name
-
Listed all employees in the Sales and Development departments, including their employee number, last name, first name, and department name
-
In descending order, list the frequency count of employee last names, i.e., how many employees share each last name
Next, I did the following:
-
Imported the SQL database into Pandas
-
Created a histogram to visualize the most common salary ranges for employees
-
Created a bar chart of average salary by title
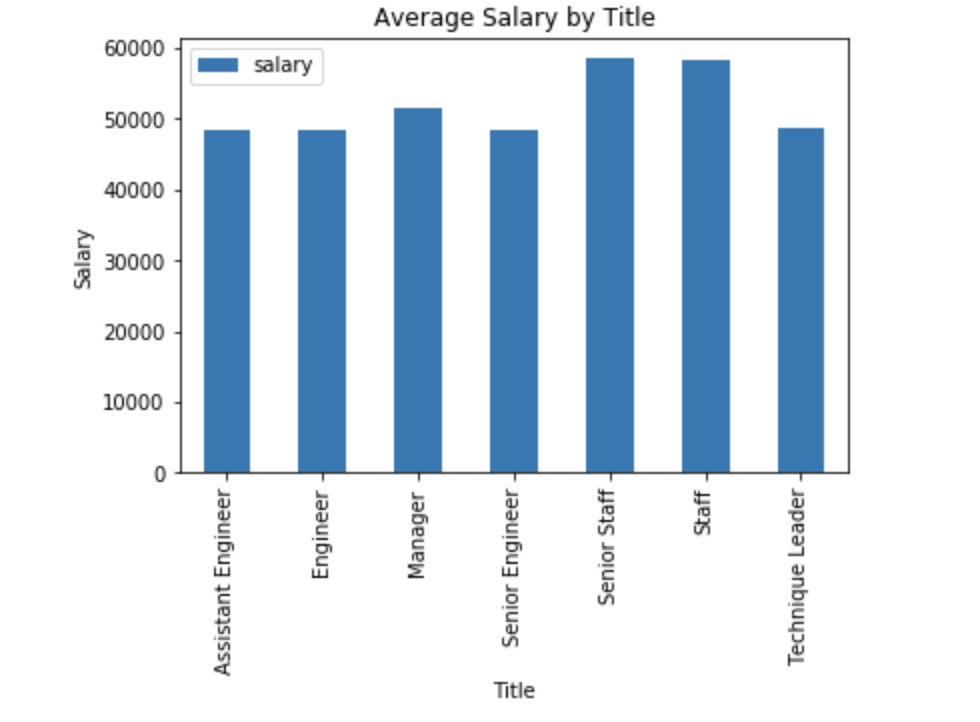
Email: cgrace1011@gmail.com