Used Python and SQLAlchemy to do basic climate analysis and data exploration of your climate database
-
Used SQLAlchemy
create_engineto connect to sqlite database -
Used SQLAlchemy
automap_base()to reflect tables into classes and saved a reference to those classes calledStationandMeasurement -
Linked Python to the database by creating an SQLAlchemy session
-
Started by finding the most recent date in the data set
-
Using this date, retrieved the last 12 months of precipitation data by querying the 12 preceding months of data
-
Selected only the
dateandprcpvalues -
Loaded the query results into a Pandas DataFrame and set the index to the date column
-
Sorted the DataFrame values by
date -
Plotted the results using the DataFrame
plotmethod: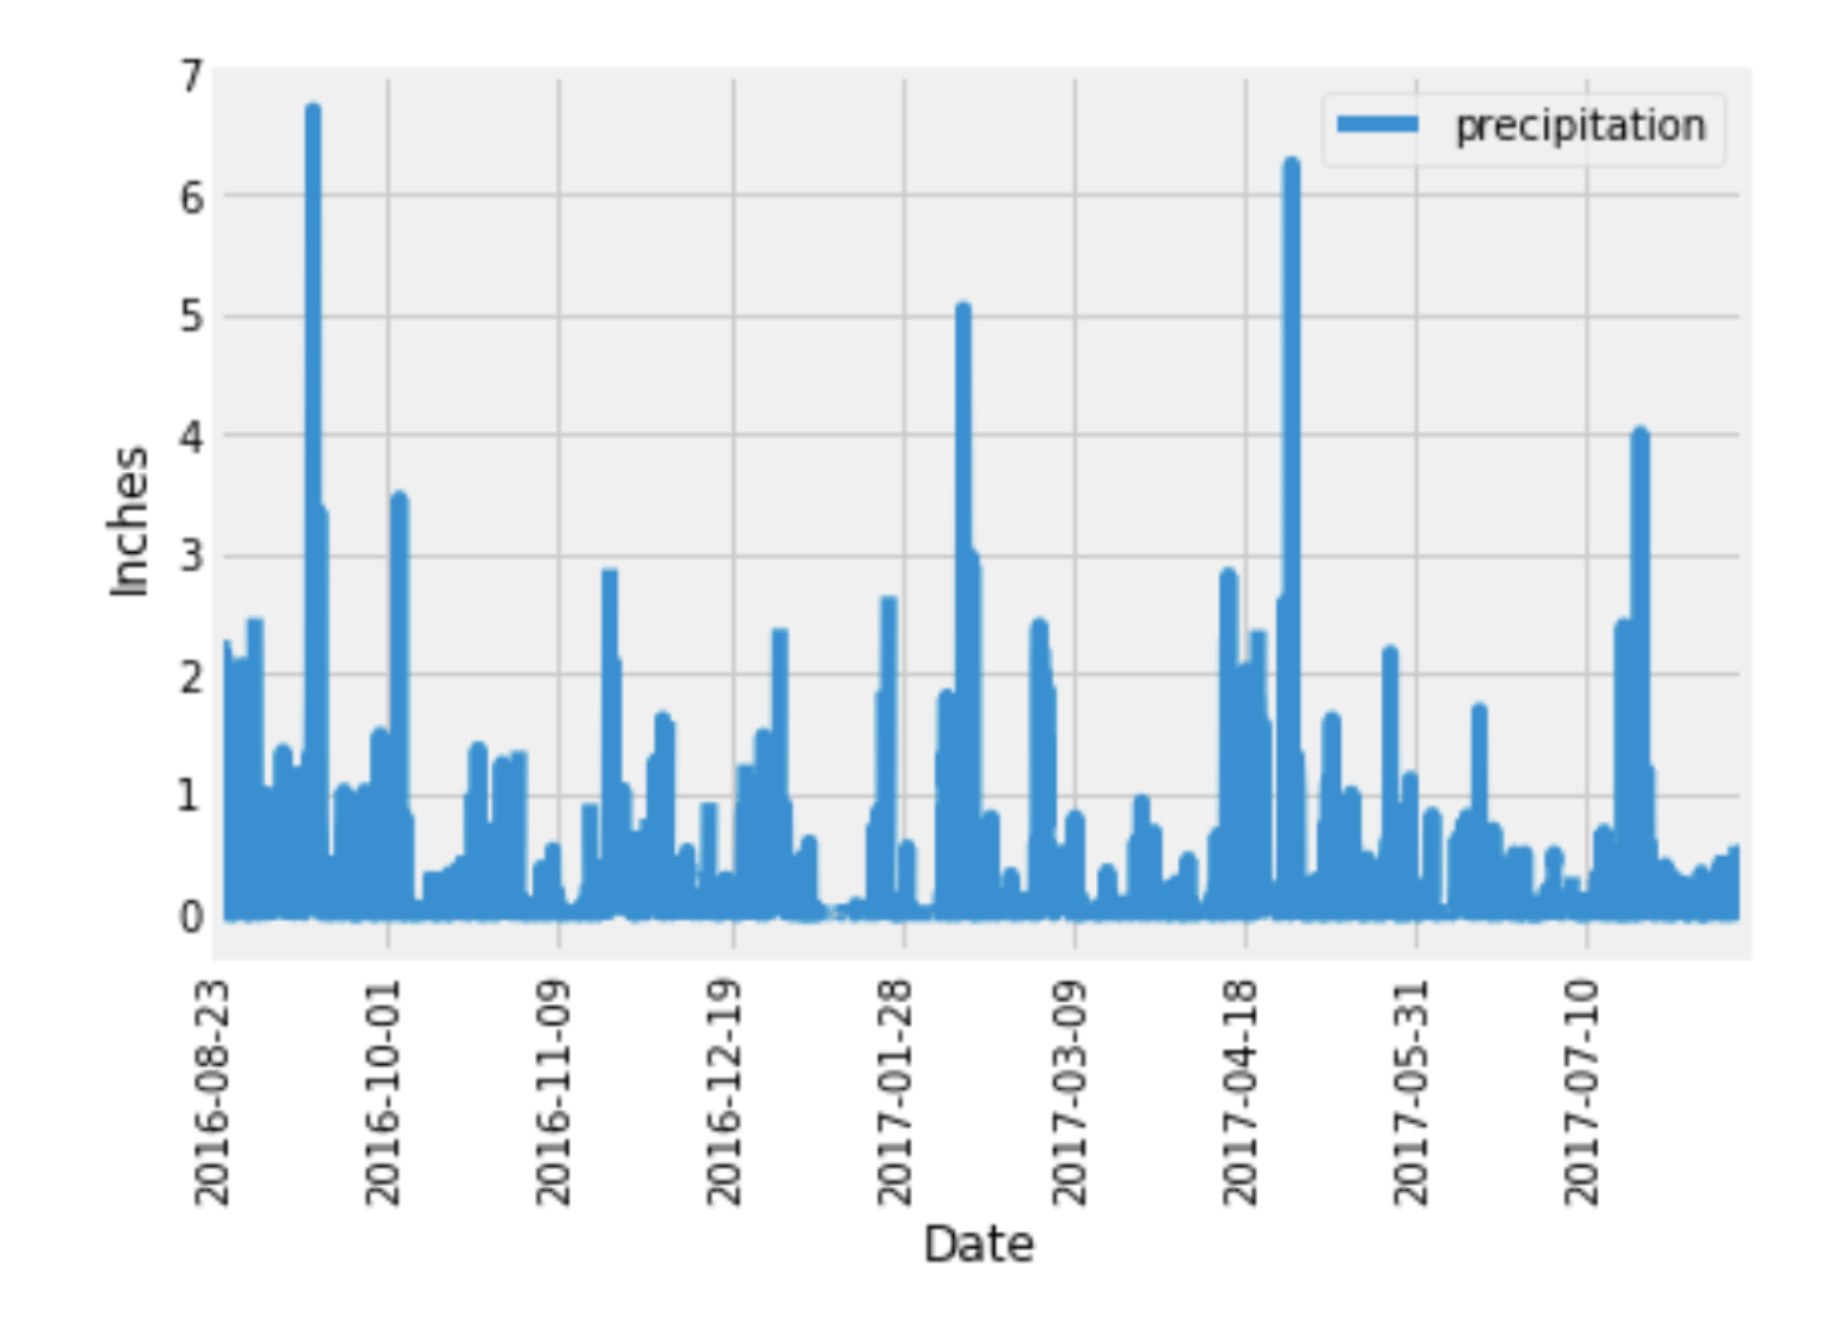
-
Used Pandas to print the summary statistics for the precipitation data
-
Designed a query to calculate the total number of stations in the dataset
-
Designed a query to find the most active stations
-
Listed the stations and observation counts in descending order
-
Which station id has the highest number of observations?
-
Using the most active station id, calculated the lowest, highest, and average temperature
-
-
Designed a query to retrieve the last 12 months of temperature observation data (TOBS)
-
Filtered by the station with the highest number of observations
-
Queried the last 12 months of temperature observation data for this station
-
Plotted the results as a histogram with
bins=12.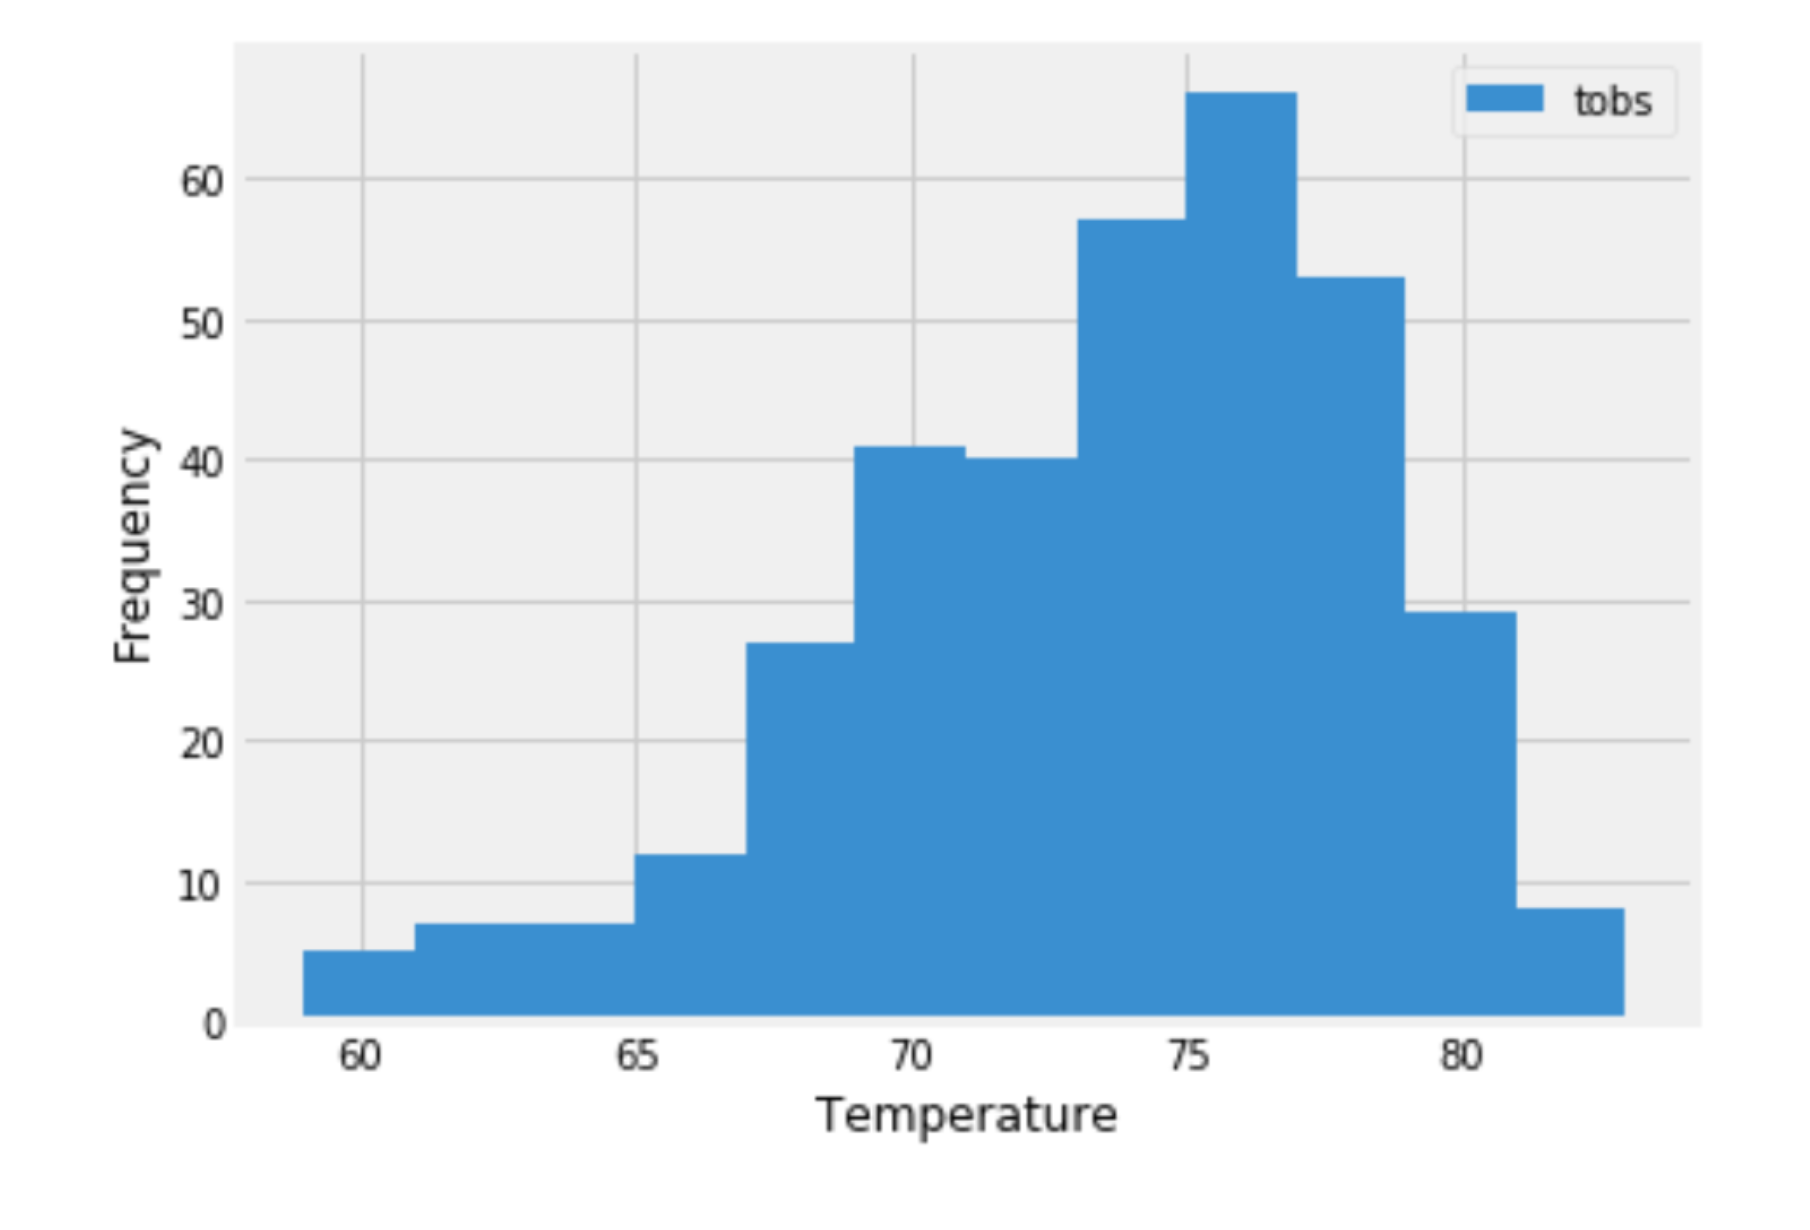
-
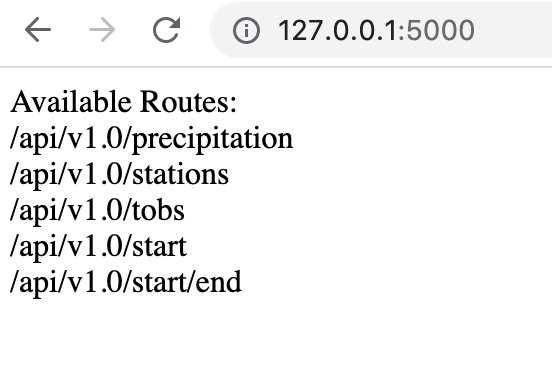
Next I design a Flask API based on the queries that you have just developed.
-
/-
Home page.
-
Listed all routes that are available.
-
-
/api/v1.0/precipitation-
Converted the query results to a dictionary using
dateas the key andprcpas the value. -
Returned the JSON representation of your dictionary.
-
-
/api/v1.0/stations- Returned a JSON list of stations from the dataset.
-
/api/v1.0/tobs-
Queried the dates and temperature observations of the most active station for the last year of data.
-
Returned a JSON list of temperature observations (TOBS) for the previous year.
-
-
/api/v1.0/<start>and/api/v1.0/<start>/<end>-
Returned a JSON list of the minimum temperature, the average temperature, and the max temperature for a given start or start-end range.
-
When given the start only, calculated
TMIN,TAVG, andTMAXfor all dates greater than and equal to the start date. -
When given the start and the end date, calculated the
TMIN,TAVG, andTMAXfor dates between the start and end date inclusive.
-
Email: cgrace1011@gmail.com
Menne, M.J., I. Durre, R.S. Vose, B.E. Gleason, and T.G. Houston, 2012: An overview of the Global Historical Climatology Network-Daily Database. Journal of Atmospheric and Oceanic Technology, 29, 897-910, https://doi.org/10.1175/JTECH-D-11-00103.1
© 2021 Trilogy Education Services, LLC, a 2U, Inc. brand. Confidential and Proprietary. All Rights Reserved.