Treemap visualization for embedded .map files — a VS Code extension that lets you see where your firmware memory and flash goes at a glance.
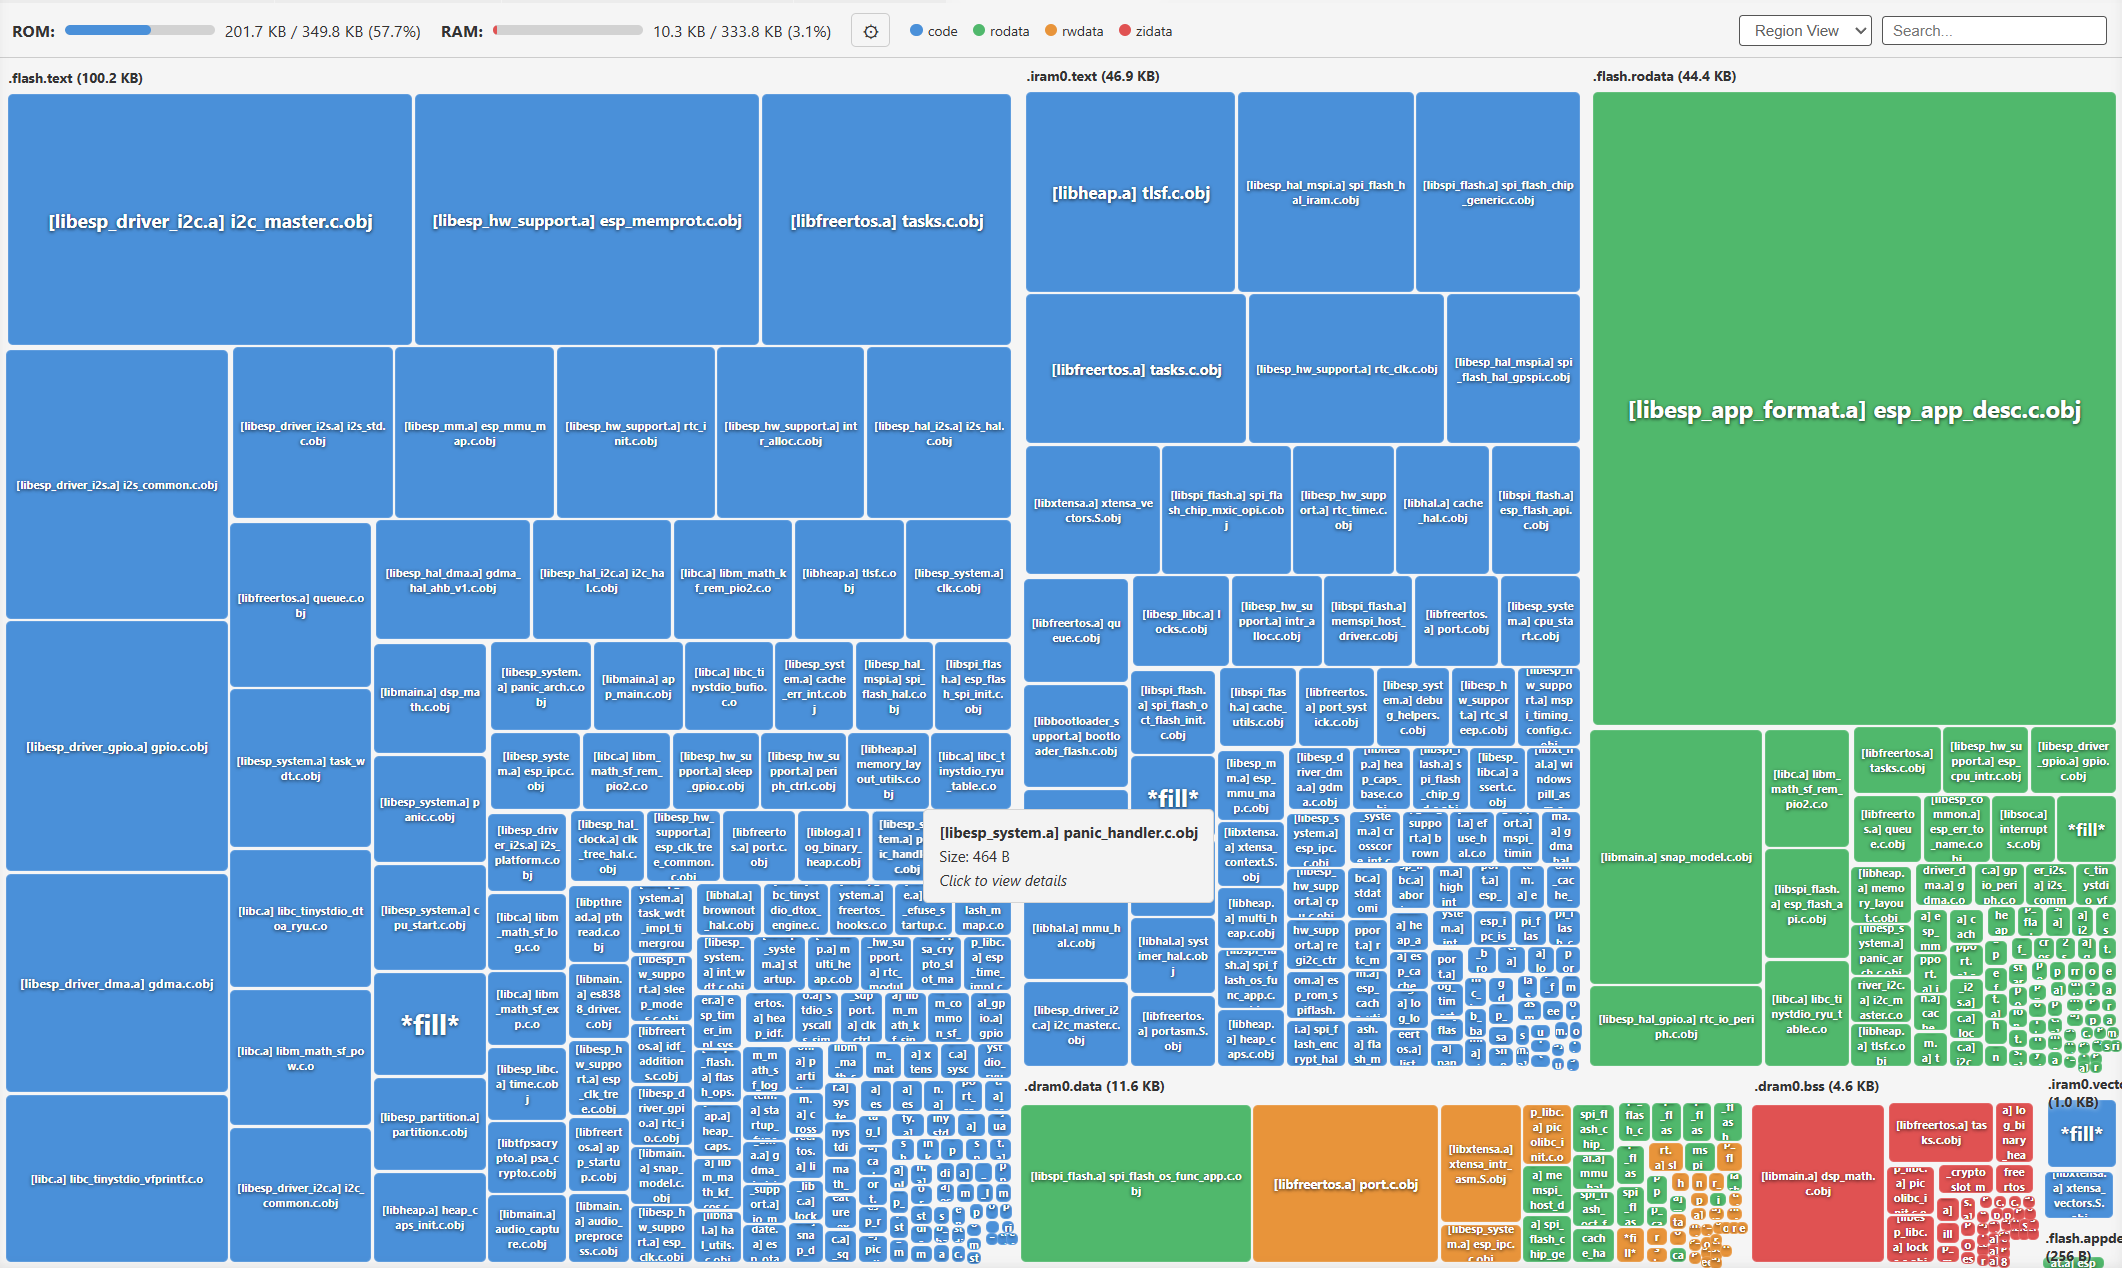
Supports Keil MDK (ARM), GCC (GNU ld), ESP-IDF, and ArtInChip (RISC-V) toolchains.
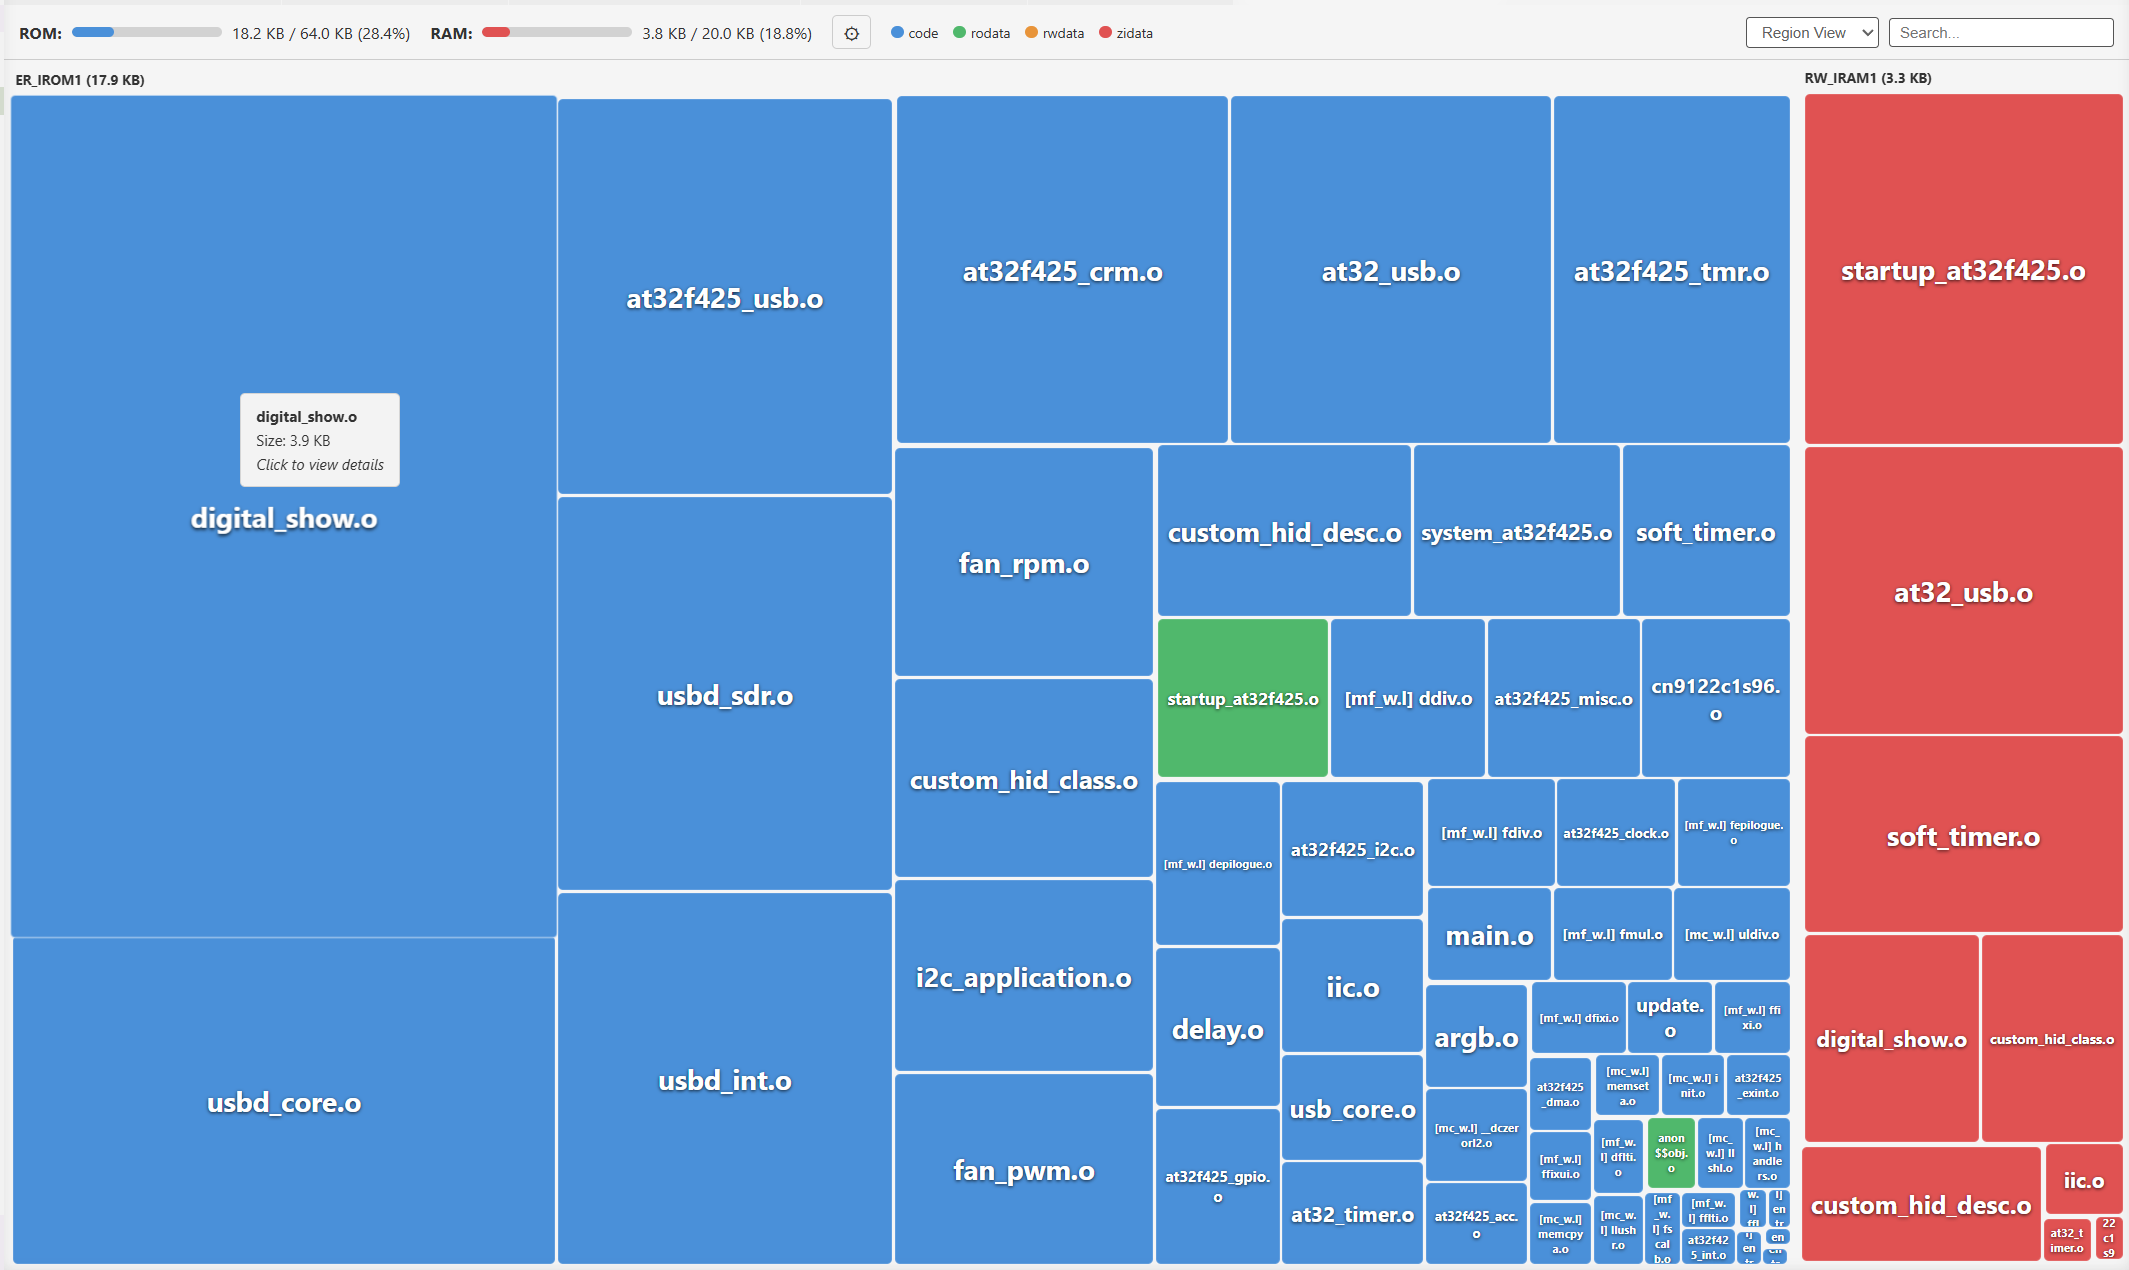
- Ultra lightweight — only ~100 KB total, installs in seconds
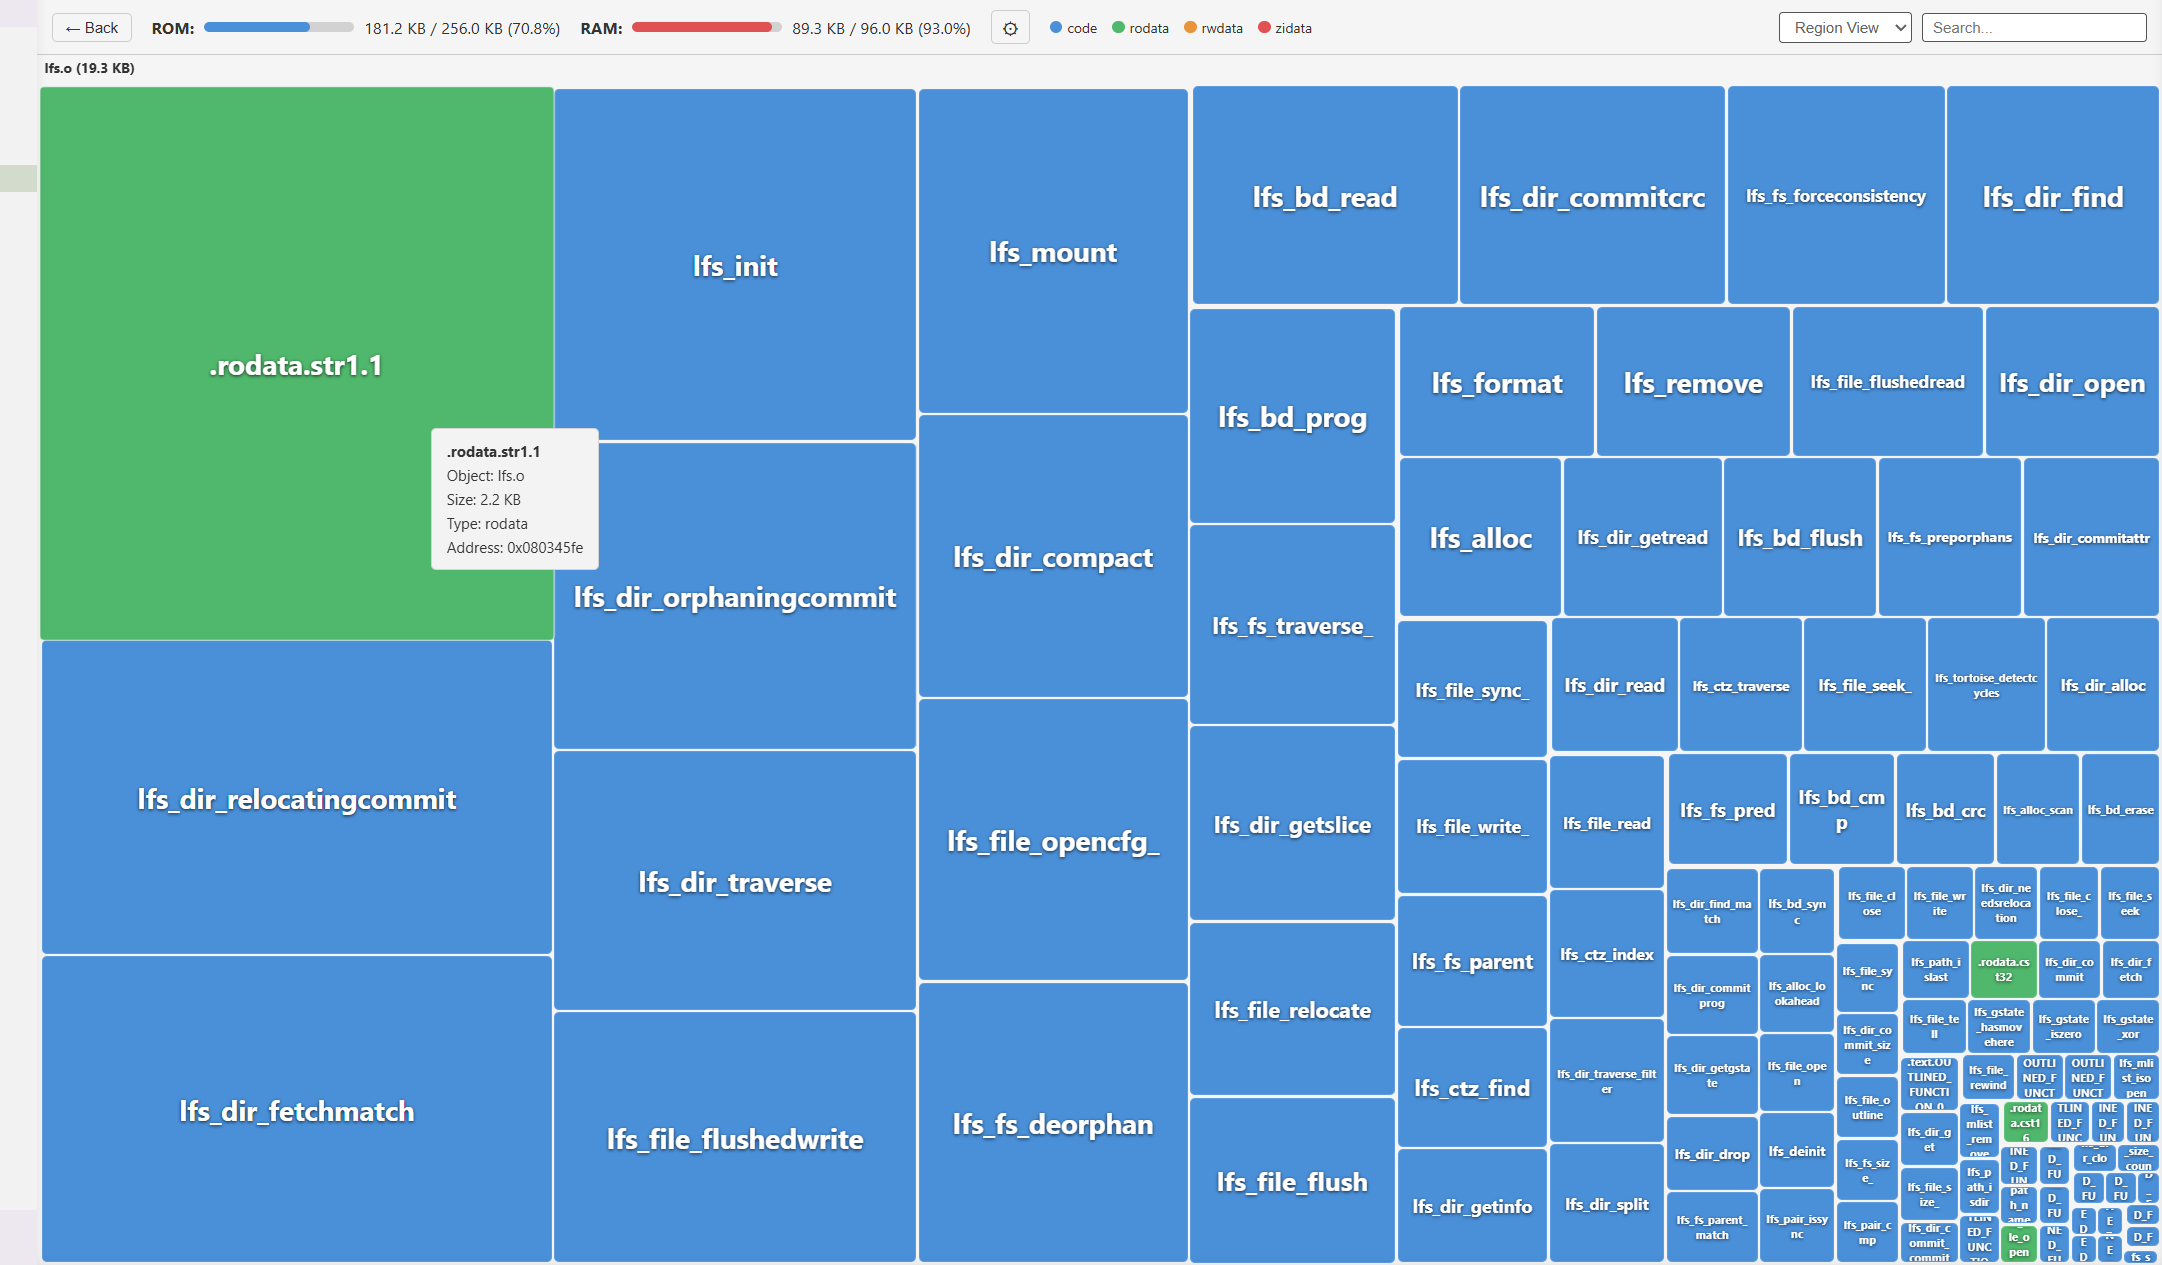
- Treemap heatmap — visualize ROM/RAM usage as color-coded blocks, sized by bytes
- Drill-down navigation — click any module to explore its internal functions and sections
- Multi-toolchain support — Keil
.map, GCC/ld.map, ESP-IDF.map, ArtInChip D13x.map - Color-coded categories — instantly distinguish Code, RO-Data, RW-Data, and ZI-Data
- Search — find any symbol, module, or library across the entire map
- Configurable memory size — set actual ROM/RAM totals for accurate percentage display
- Zero dependencies — pure TypeScript, no external runtime libraries
| Toolchain | Compiler | Example Chips |
|---|---|---|
| Keil MDK | ARMCC / ARM Compiler 6 | STM32, AT32, GD32 |
| GCC (GNU ld) | arm-none-eabi-gcc, riscv-gcc | Any ARM/RISC-V with ld |
| ESP-IDF | xtensa-gcc, riscv32-gcc | ESP32, ESP32-S3, ESP32-C3 |
| ArtInChip | riscv64-unknown-elf-gcc | D13x, D12x |
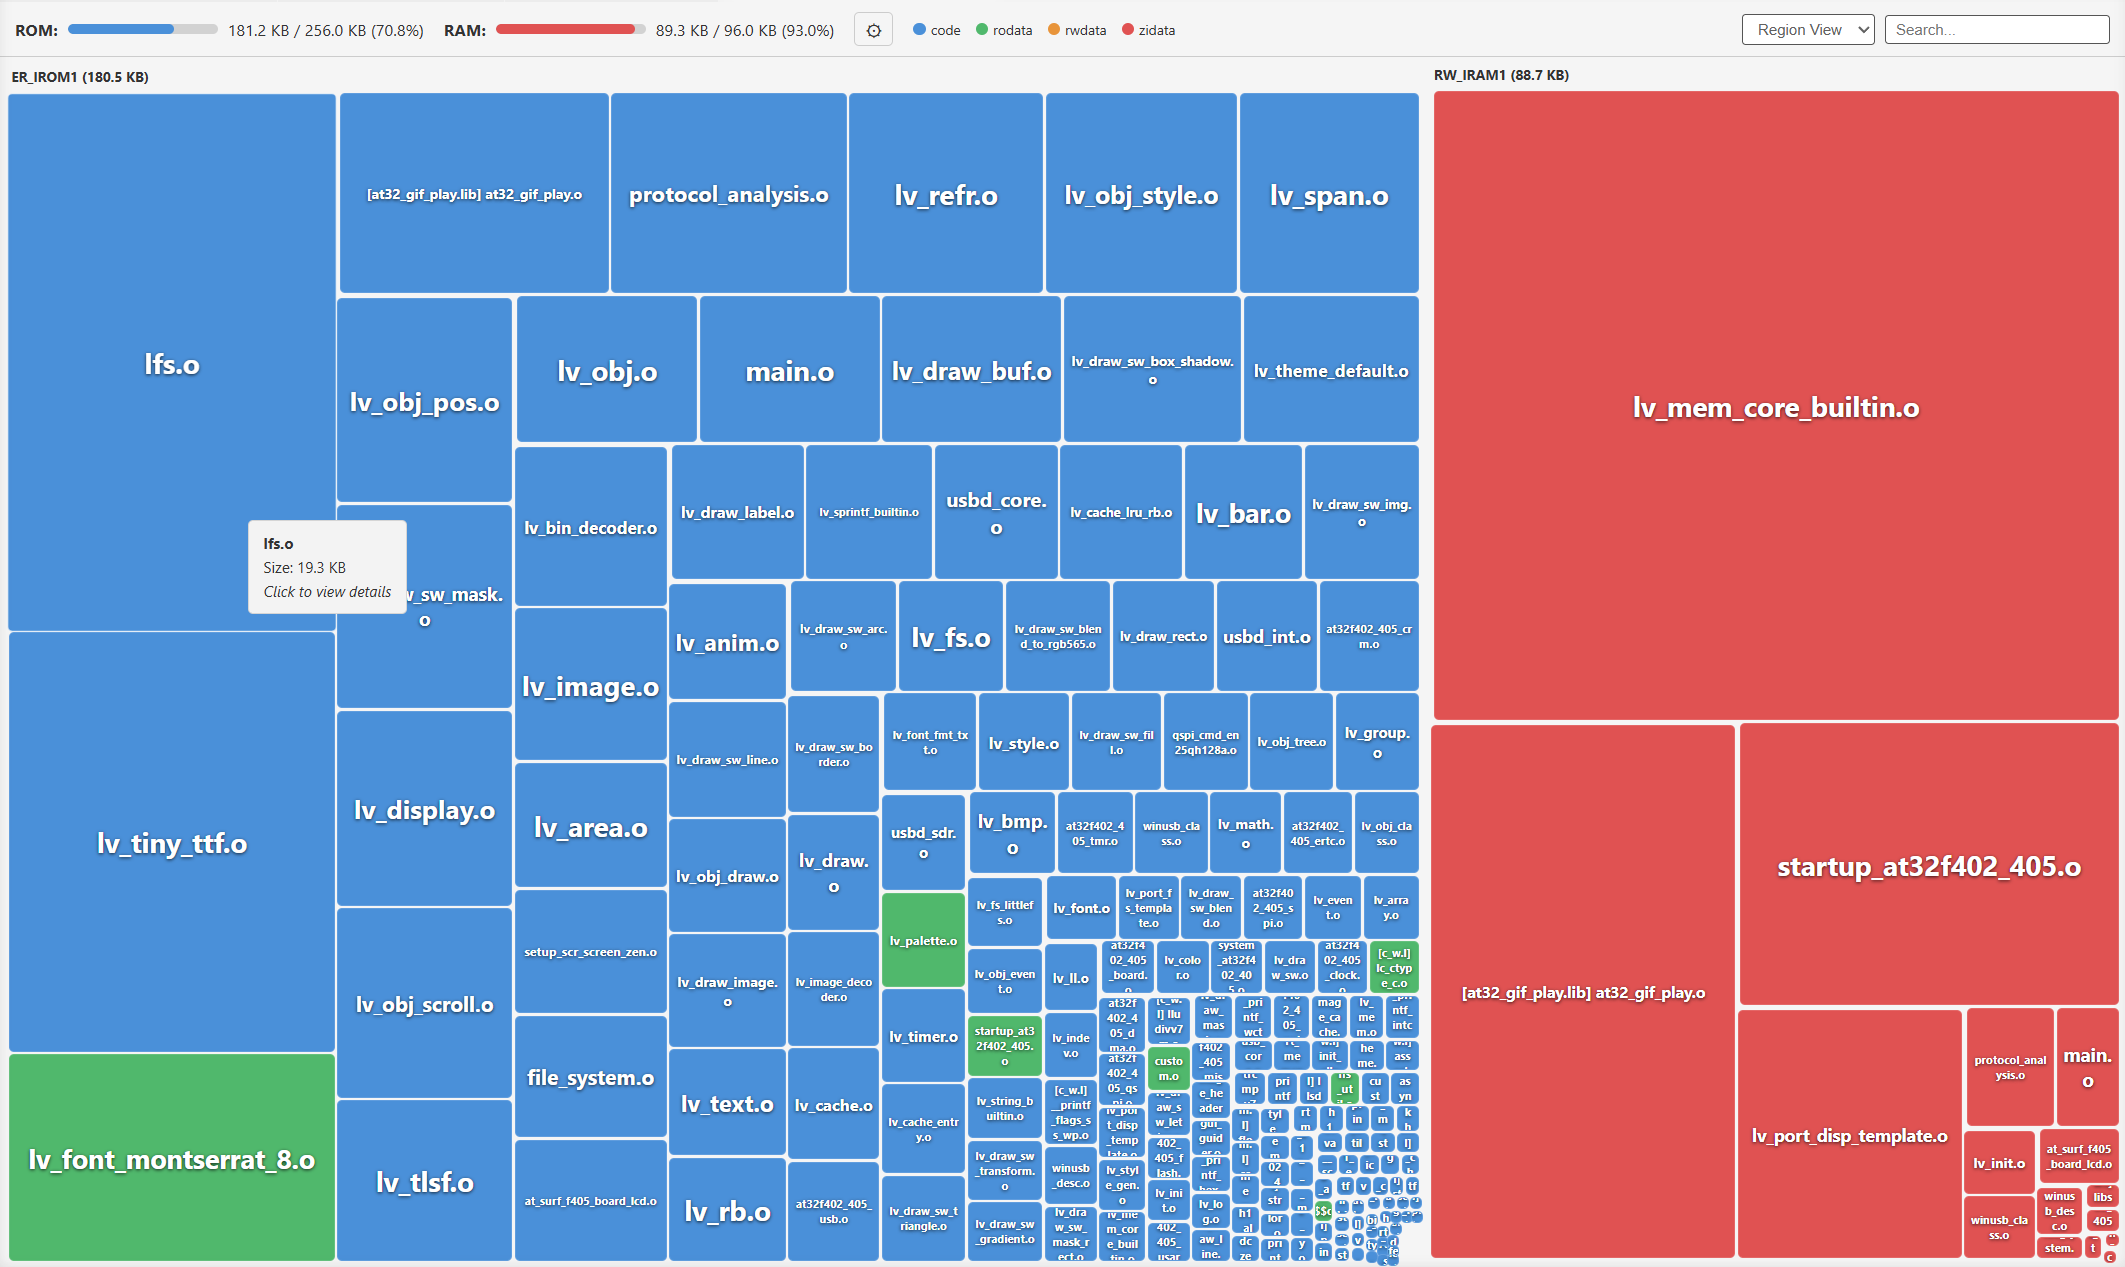
Click the gear icon in the toolbar to set ROM/RAM sizes (in KB) for accurate usage percentages. Settings are stored per-file in .vscode/settings.json.
- Open VS Code
- Go to Extensions (
Ctrl+Shift+X) - Search for "Map View Embedded"
- Click Install
- Use
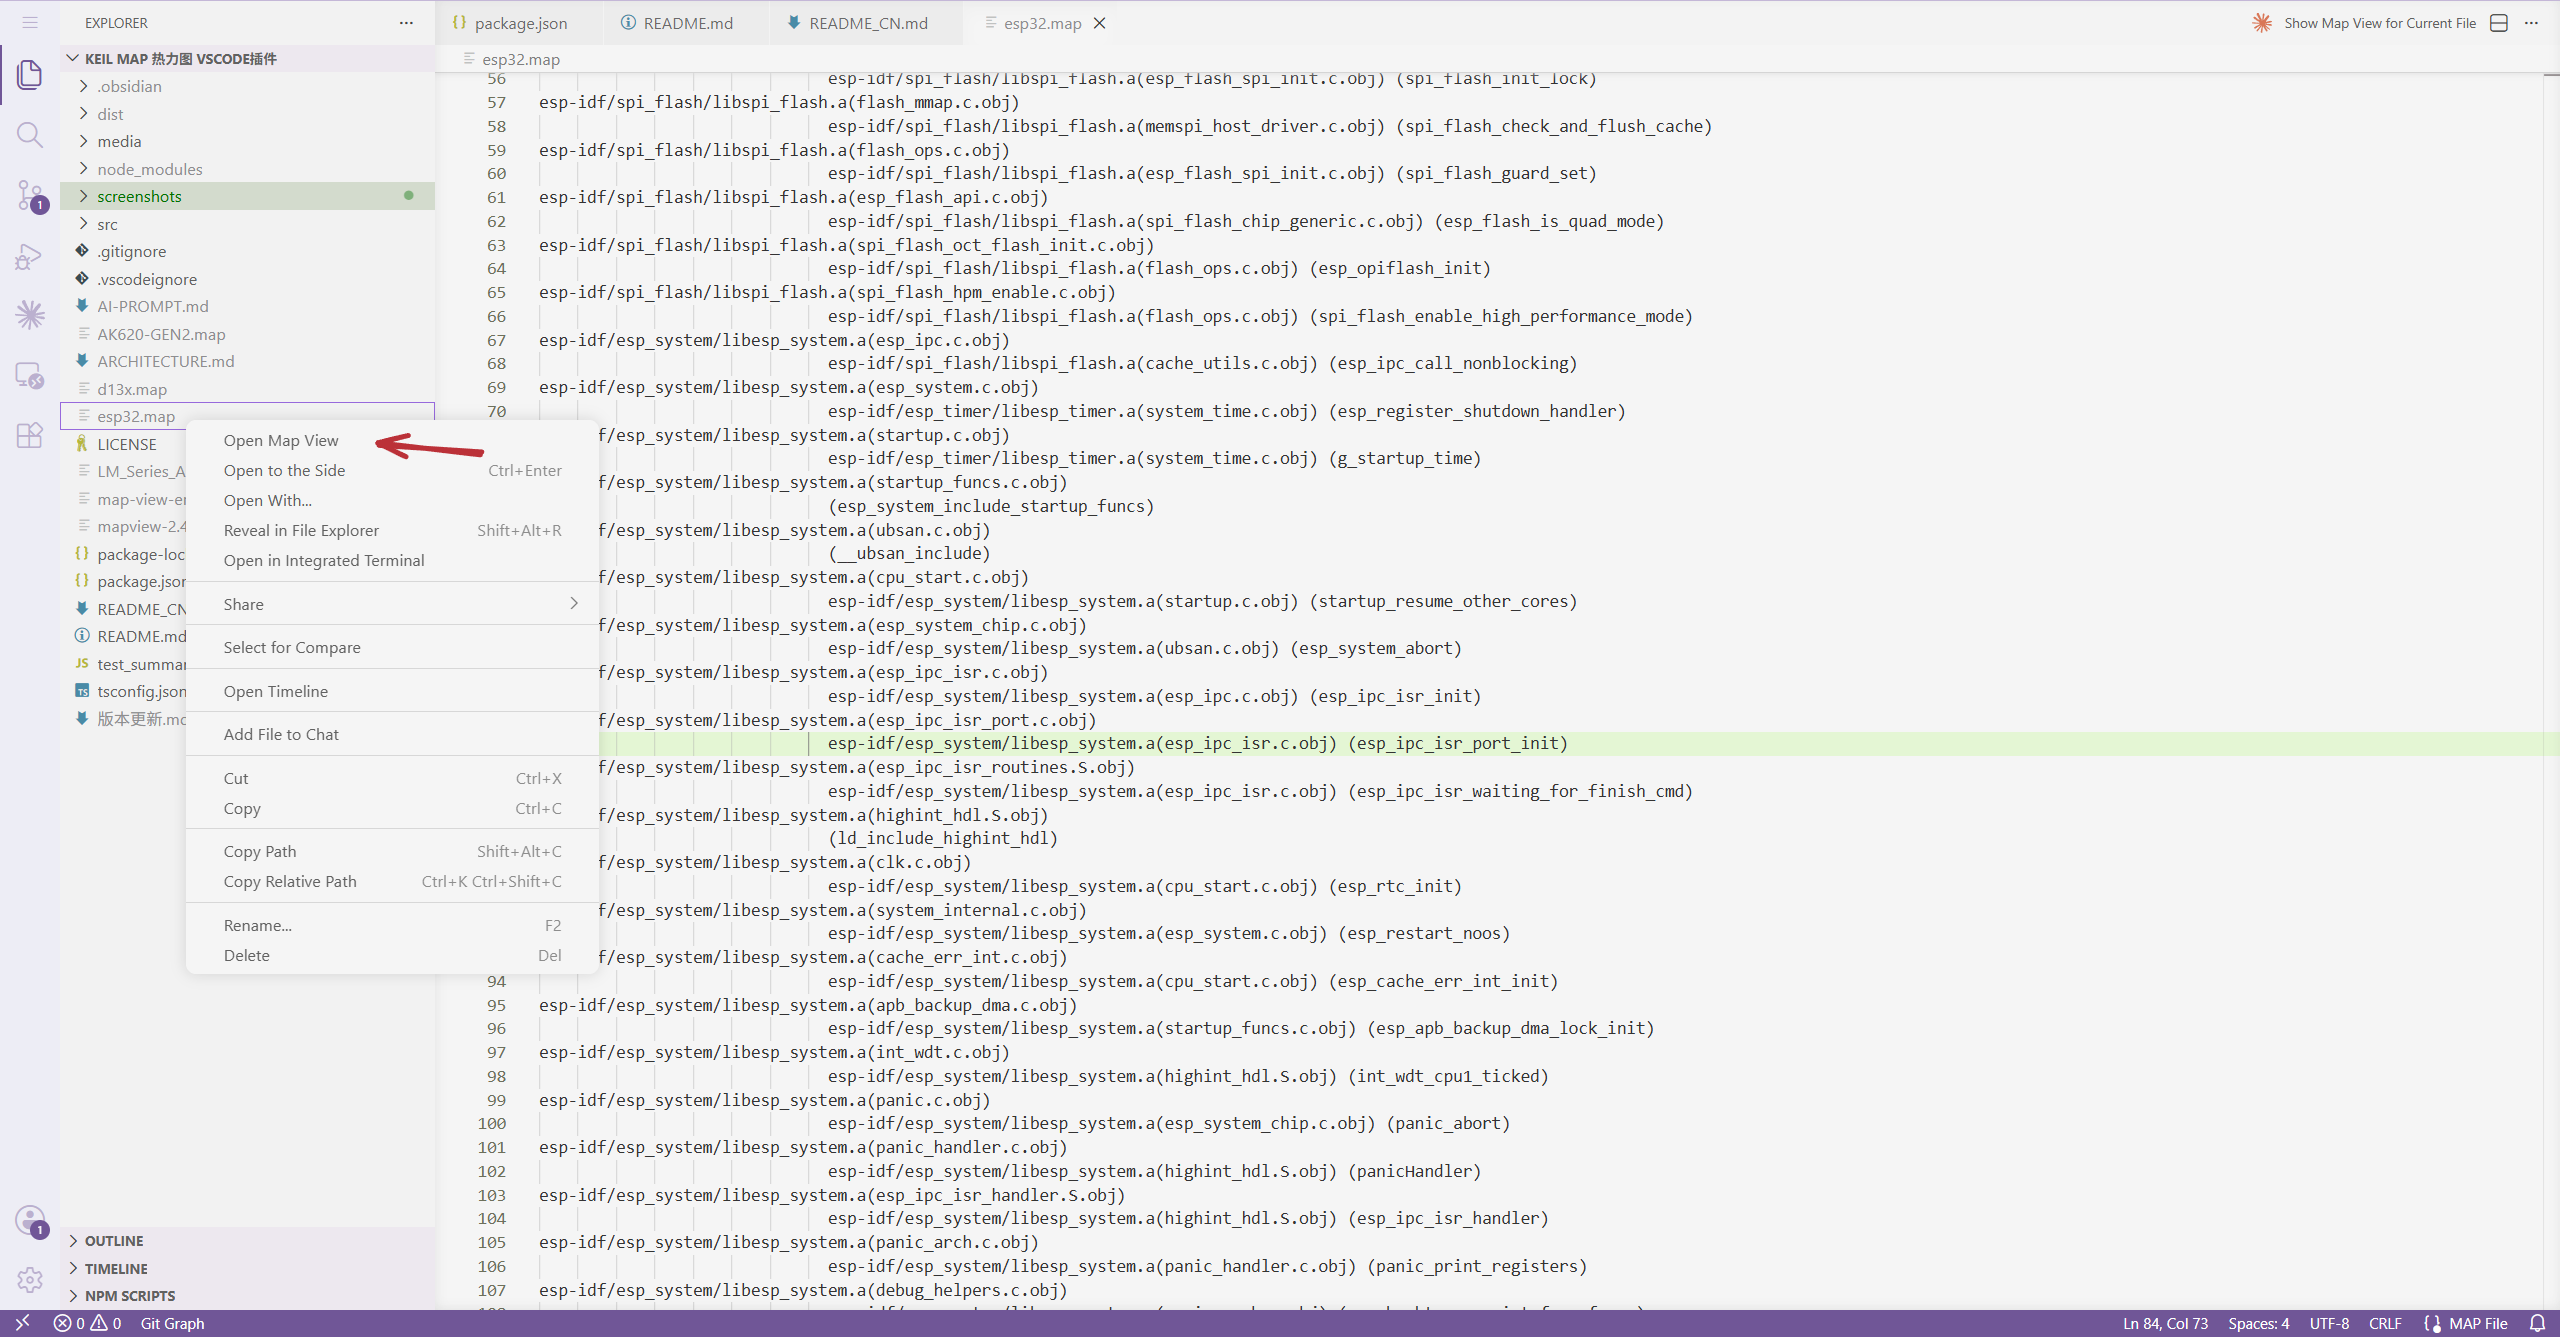
Ctrl+Pto search and locate themapfile in your project - Right-click → Open Map View
- Click modules to drill down, click "Back" to navigate up
- The ROM/RAM usage shown is based solely on what the
.mapfile contains. External memory (e.g., off-chip Flash, external SRAM) or regions not reported by the linker will not appear automatically. - If the displayed totals seem inaccurate, click the gear icon to manually configure the actual ROM/RAM sizes for your target hardware.
MIT