When plotting line graph with object data structure the x property is ignored if not a string #10617
Description
Expected behavior
The expected behaviour is the x property in the object to be plotted can either be a number or string as the examples on the data structures page shows.
Current behavior
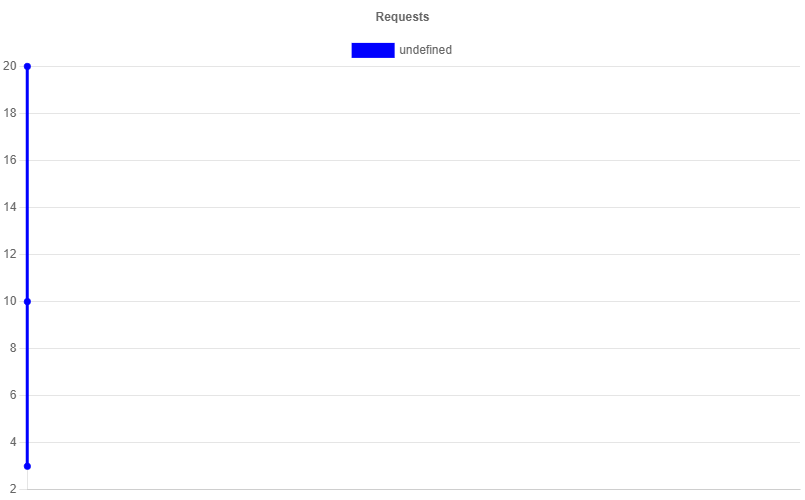
The current behaviour plots all x values as zero if they are a number type.
Plots all x values as zero:
type: 'line', data: { datasets: [{ data: [{x: 10, y: 20}, {x: 15, y: 3}, {x: 20, y: 10}] }] }
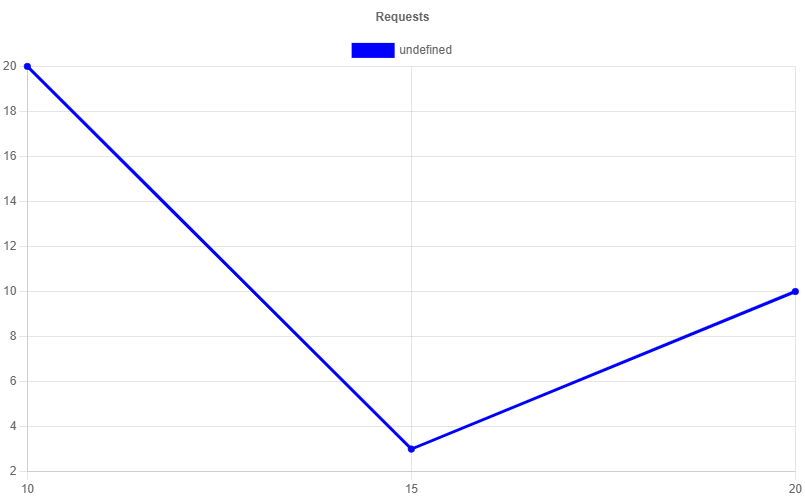
Plots all x values correctly:
type: 'line', data: { datasets: [{ data: [{x: '10', y: 20}, {x: '15', y: 3}, {x: '20', y: 10}] }] }
Reproducible sample
https://codepen.io/KevinPluck/pen/LYdaogr
Optional extra steps/info to reproduce
No response
Possible solution
No response
Context
No response
chart.js version
v3.9.1
Browser name and version
Chrome Version 104.0.5112.82
Link to your project
No response