LineChart / Stacked Series / Wrong backgroundfill. #11182
Description
Expected behavior
I'm creating a graph for my PV System.
The 3 values relevant for this issue are:
- PV Production
- Consumption
- Battery Charge Rate.
In Order to be able to see the overall consumption in the chart, I've stacked "Consumption" and "Battery Charge Rate" into the stack "consumer". Both Series have transparent background-fillings.
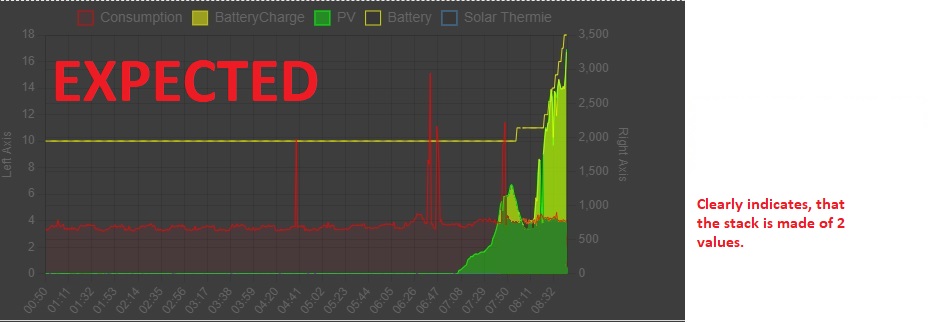
Expectation:
With values of
Consumption: 1000
Battery Charge Rate: 500
the stack goes up to 1500, showing me the lines filled like:
0-1000 @ consumption filling (red)
1000-1500 @ battery charge filling (yellow)
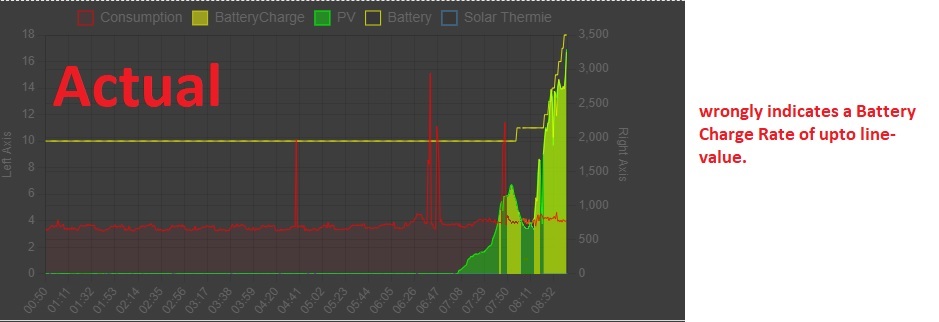
Current behavior
The lines themself stack as expected (so early in the day, "consumption + batterycharge == PV Production"), but the background-filling of "Battery Charge Rate" is reaching all the way down to 0.
Therefore with the mentioned values, it leads to an overall height of the stack of 1500 (which is right), but since the background filling is going down to zero, one would expect a Battery Charge Rate of 1500 when looking at the graph.
Expectation: The background-filling of the upper lines in a stack should only reach down to the prior line in the stack, not down to 0.
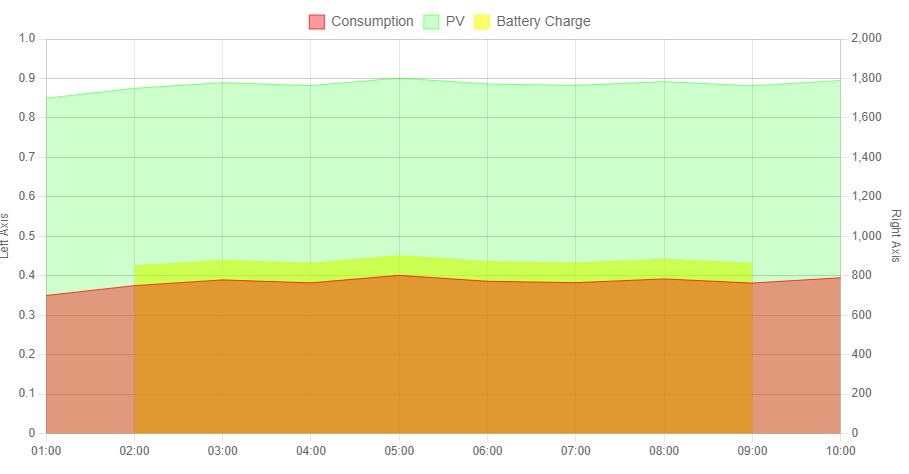
Reproducible sample
https://jsfiddle.net/fx6zsvj1/1/
The attached example is simplified to a consistend battery charge of 100.
While only the portion above the consumption line should be yellowish, when using transparent
background, the background stretches all the way down to 0.
Looking at the graph like this doesn't show that they are stacked, leading to the assumption of a Battery Charge
of about 800 - 900.
Sample ACTUAL:
Sample EXPECTED:

Optional extra steps/info to reproduce
- Stack 2 lines.
- give them transparent background filling
- See filling of upper line going down to 0, rather than to the value of the prior line in the stack.
Possible solution
See attached Screenshot
Context
see issue description
chart.js version
https://cdn.jsdelivr.net/npm/chart.js
Browser name and version
chrome latest
Link to your project
na