A fully functional Angular2+ chart.js library.This chart library based on ng2-charts.
Thanks to valor-software's ng2-charts.
1.You can install ng-chartjs using npm
npm install ng-chartjs --save
2.You need to install Chart.js library in application.
npm install chart.js --save
- To be added
1.Normal import.
import { NgChartjsModule } from 'ng-chartjs';

// In your App's module:
imports: [
   NgChartjsModule
]
2.Importing global plugin.
import { NgChartjsModule } from 'ng-chartjs';

// In your App's module:
imports: [
   NgChartjsModule.registerPlugin([...])
]
- line
- bar
- radar
- pie
- polarArea
Use the plugins Properties.
eg. source code
html file.
<canvas ngChartjs [datasets]="lineChartData" [labels]="lineChartLabels"
          [options]="lineChartOptions" [legend]="lineChartLegend" [chartType]="lineChartType"
          [inlinePlugins]="inlinePlugin">
</canvas>
ts file.
...
lineChartData: Array<any> = [
    {
      label: 'My First dataset',
      fill: false,
      lineTension: 0.1,
      backgroundColor: 'rgba(75,192,192,0.4)',
      borderColor: 'rgba(75,192,192,1)',
      borderCapStyle: 'butt',
      borderDash: [],
      borderDashOffset: 0.0,
      borderJoinStyle: 'miter',
      pointBorderColor: 'rgba(75,192,192,1)',
      pointBackgroundColor: '#fff',
      pointBorderWidth: 1,
      pointHoverRadius: 5,
      pointHoverBackgroundColor: 'rgba(75,192,192,1)',
      pointHoverBorderColor: 'rgba(220,220,220,1)',
      pointHoverBorderWidth: 2,
      pointRadius: 1,
      pointHitRadius: 10,
      data: [65, 59, 80, 81, 56, 55, 40],
    },
  ];
  lineChartLabels: Array<any> = ['January', 'February', 'March', 'April', 'May', 'June', 'July'];
  lineChartOptions: any = {
    responsive: true
  };
   lineChartLegend = true;
  lineChartType = 'line';
  inlinePlugin: any;
  textPlugin: any;

  ngOnInit() {
    // inline plugin
    this.textPlugin = [{
      id: 'textPlugin',
      beforeDraw(chart: any): any {
        const width = chart.chart.width;
        const height = chart.chart.height;
        const ctx = chart.chart.ctx;
        ctx.restore();
        const fontSize = (height / 114).toFixed(2);
        ctx.font = `${fontSize}em sans-serif`;
        ctx.textBaseline = 'middle';
        const text = 'Text Plugin';
        const textX = Math.round((width - ctx.measureText(text).width) / 2);
        const textY = height / 2;
        ctx.fillText(text, textX, textY);
        ctx.save();
      }
    }];

    this.inlinePlugin = this.textPlugin;
  }
  ...
View
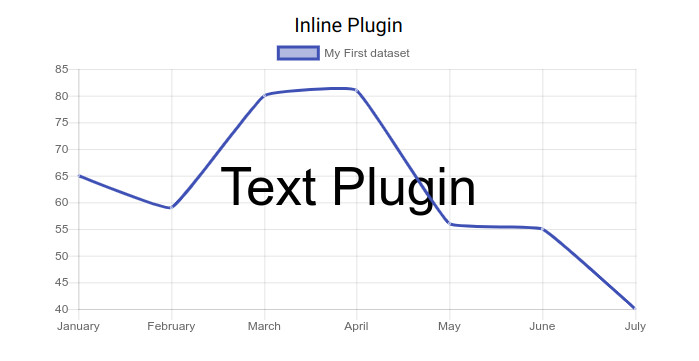
The plugins properties is an array of objects that allows multiple inline plugins to be used simultaneously.
Using the registration API in app.module.ts.
eg. source code
Customize global plugin.
export function horizonalLine(chartInstance) {
  const yScale = chartInstance.scales['y-axis-0'];
  const canvas = chartInstance.chart;
  const ctx = canvas.ctx;
  let index;
  let line;
  let style;
  let yValue;
  if (chartInstance.options.horizontalLine) {
    for (index = 0; index < chartInstance.options.horizontalLine.length; index++) {
      line = chartInstance.options.horizontalLine[index];

      if (!line.style) {
        style = 'rgba(169,169,169, .6)';
      } else {
        style = line.style;
      }

      if (line.y) {
        yValue = yScale.getPixelForValue(line.y);
      } else {
        yValue = 0;
      }

      ctx.lineWidth = 3;

      if (yValue) {
        ctx.beginPath();
        ctx.moveTo(0, yValue);
        ctx.lineTo(canvas.width, yValue);
        ctx.strokeStyle = style;
        ctx.stroke();
      }

      if (line.text) {
        ctx.fillStyle = style;
        ctx.fillText(line.text, 0, yValue + ctx.lineWidth);
      }
    }
    return;
  }
}

const horizonalLinePlugin = {
  beforeDraw: horizonalLine
};
Register global plugin
import { NgChartjsModule } from 'ng-chartjs';

// In your App's module:
imports: [
   NgChartjsModule.registerPlugin([horizonalLinePlugin])
]
html file.
 <canvas ngChartjs [datasets]="lineChartData" [labels]="lineChartLabels"
            [options]="lineChartOptions" [legend]="lineChartLegend" [chartType]="lineChartType">
</canvas>
ts file.
lineChartData: Array<any> = [
    {
      label: 'My First dataset',
      fill: false,
      lineTension: 0.1,
      backgroundColor: 'rgba(75,192,192,0.4)',
      borderColor: 'rgba(75,192,192,1)',
      borderCapStyle: 'butt',
      borderDash: [],
      borderDashOffset: 0.0,
      borderJoinStyle: 'miter',
      pointBorderColor: 'rgba(75,192,192,1)',
      pointBackgroundColor: '#fff',
      pointBorderWidth: 1,
      pointHoverRadius: 5,
      pointHoverBackgroundColor: 'rgba(75,192,192,1)',
      pointHoverBorderColor: 'rgba(220,220,220,1)',
      pointHoverBorderWidth: 2,
      pointRadius: 1,
      pointHitRadius: 10,
      data: [65, 59, 80, 81, 56, 55, 40],
    },
  ];
  lineChartLabels: Array<any> = ['January', 'February', 'March', 'April', 'May', 'June', 'July'];
  lineChartOptions: any = {
    responsive: true,
    horizontalLine: [{  // use custom global plugin
      y: 82,
      style: 'rgba(255, 0, 0, .4)',
      text: 'max'
    }, {
      y: 60,
      style: '#00ffff',
    }, {
      y: 44,
      text: 'min'
    }]
  };
  lineChartLegend = true;
  lineChartType = 'line';
View

Import third-party plugin libraries.
eg. source code
import * as ChartAnnotation from 'chartjs-plugin-annotation';
const chartAnnotation = ChartAnnotation;
...

// In your App's module:
imports: [
   NgChartjsModule.registerPlugin([chartAnnotation])
]
Using the plugin directly within the options property.
options = {
	responsive: true,
	annotation: {  // use global plugin.
	      annotations: [
	      {
		  drawTime: 'afterDraw',
		  type: 'line',
		  mode: 'horizontal',
		  scaleID: 'y-axis-0',
		  value: 70,
		  borderColor: '#000000',
		  borderWidth: 2,
		  label: {
		    backgroundColor: 'red',
		    content: 'Target line',
		    enabled: true,
		    position: 'center',
		  }
		}
	      ]
	}
};
View
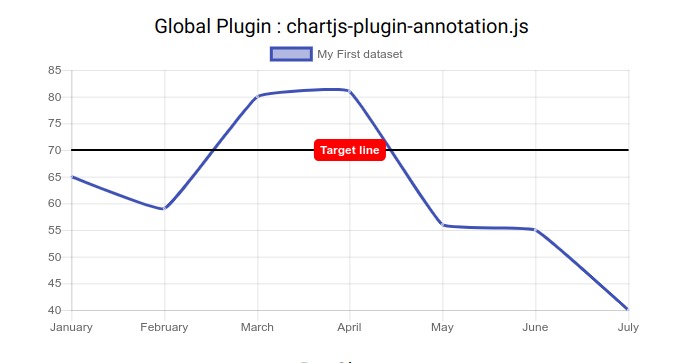
The parameter of registerPlugin function is an array of objects.
Set the id attribute of the element,then Get the chart.js object by id. see source code
html file
    <div style="position: relative; width: 600px;">
      <canvas id="testChart" ngChartjs [datasets]="lineChartData" [labels]="lineChartLabels"
      [options]="lineChartOptions" [legend]="lineChartLegend" [chartType]="lineChartType" [resetOption]="resetOption"></canvas>
    </div>
ts file
...
import { NgChartjsService } from 'ng-chartjs';
...
ngInit() {
    const chart: any = this.ngChartjsService.getChart('testChart');
    chart.options.scales.xAxes[0].ticks.display = false;
    chart.update();
}
...
import { getColors } from 'ng-chartjs';
generateColor, generateColors...
| Property | Type | Explanation |
|---|---|---|
| data | Array<number[]> | number[] |
| datasets | Array<{data: Array<number[]> | number[], label: string}> |
| labels | ?Array | x axis labels. It's necessary for charts: line, bar and radar. And just labels (on hover) for charts: polarArea, pie and doughnut |
| chartType | ?string | indicates the type of charts, it can be: line, bar, radar, pie, polarArea, doughnut |
| options | ?any | chart options (as from Chart.js documentation) |
| colors | ?Array | data colors, will use default and |
| legend | ?boolean=false | if true show legend below the chart, otherwise not be shown |
| inlinePlugins | any[] | Chart.js inline plugin. Chart.js Plugins, Other Reference |
| adding | { labels: any[], data: any[][] } |
You can add new data and update chart. It needs to be reassigned to trigger. |
| removing | {orientation: string} |
You can delete the latest or oldest data.It needs to be reassigned to trigger |
| resetOption | any | Reset options can trigger update chart |
- chartClick : fires when click on a chart has occurred, returns information regarding active points and labels
- chartHover : fires when mousemove (hover) on a chart has occurred, returns information regarding active points and labels
The MIT License (see the LICENSE file for the full text)