Issue
In case of uncaught exceptions from app.call(), the logic of the request_metrics middleware, after app.call() is skipped and therefore the metric is not being decreased.
Context
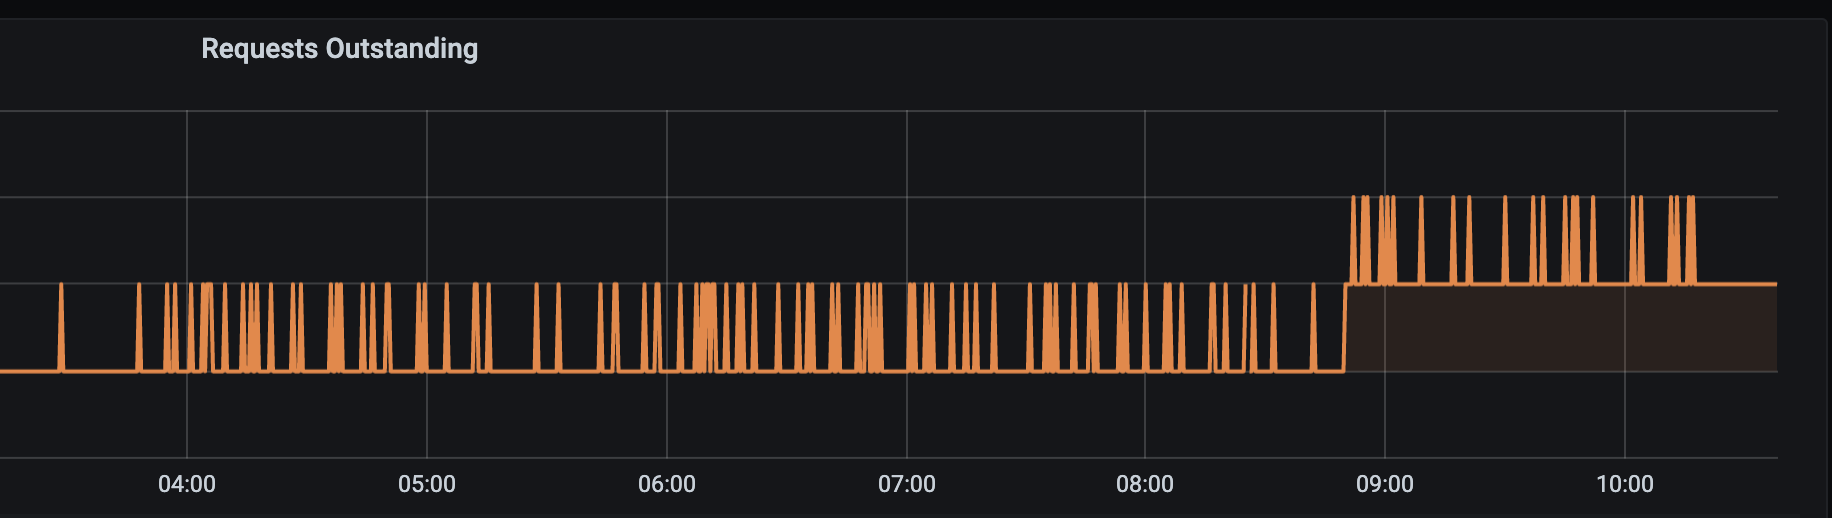
We were facing jumps in the 'cc.requests.outstanding.gauge' metric during CC DB restarts. The metric would never reach 0 again and we would see values > 20, which is not possible because the limit of the CC is 20 simultaneous requests. In Grafana the metric looked like this:
After reproducing the issue by restarting the DB manually, we saw that this happens when a DB error occurs in some middleware e.g. the security_context_setter because there some user data is being fetched from the DB. The error is not caught anywhere until it reaches the thin layer, which will return a 500 to the client. All middlewares in between are being skipped though.
Steps to Reproduce
The easiest way is to add raise Exception("CUSTOM EXCEPTION") in line 9 in security_context_configurer.rb. This will cause the metric to increase, but never decrease for all requests.
Another option is to just restart the CC DB, while there is some load on the CC. It does not happen every time, but very often.
Expected result
No matter what happens behind the request_metrics middleware, the metric should be decreased when the request erred or finished.
Current result
Metric does not decrease and therefore is not correct. Here a log which shows that the metric reached 81:
{"timestamp":"2021-07-13T11:44:26.736233000Z","message":"Statsd: cc.requests.outstanding.gauge:81|g","log_level":"debug","source":"statsd.client","data":{"request_guid":"52ae4842-35ce-42e0-b775-b48c6a1999c0"},"thread_id":69480,"fiber_id":69500,"process_id":20610,"file":"/usr/local/bundle/gems/statsd-ruby-1.4.0/lib/statsd.rb","lineno":457,"method":"send_to_socket"}
{"timestamp":"2021-07-13T11:44:26.737004400Z","message":"Statsd: cc.requests.outstanding:1|c","log_level":"debug","source":"statsd.client","data":{"request_guid":"52ae4842-35ce-42e0-b775-b48c6a1999c0"},"thread_id":69480,"fiber_id":69500,"process_id":20610,"file":"/usr/local/bundle/gems/statsd-ruby-1.4.0/lib/statsd.rb","lineno":457,"method":"send_to_socket"}
Possible Fix
Catch all exceptions in the request_metrics middleware and decrease the metric. Then raise the exception again.
Issue
In case of uncaught exceptions from app.call(), the logic of the request_metrics middleware, after app.call() is skipped and therefore the metric is not being decreased.
Context
We were facing jumps in the 'cc.requests.outstanding.gauge' metric during CC DB restarts. The metric would never reach 0 again and we would see values > 20, which is not possible because the limit of the CC is 20 simultaneous requests. In Grafana the metric looked like this:
After reproducing the issue by restarting the DB manually, we saw that this happens when a DB error occurs in some middleware e.g. the
security_context_setterbecause there some user data is being fetched from the DB. The error is not caught anywhere until it reaches the thin layer, which will return a 500 to the client. All middlewares in between are being skipped though.Steps to Reproduce
The easiest way is to add
raise Exception("CUSTOM EXCEPTION")in line 9 insecurity_context_configurer.rb. This will cause the metric to increase, but never decrease for all requests.Another option is to just restart the CC DB, while there is some load on the CC. It does not happen every time, but very often.
Expected result
No matter what happens behind the request_metrics middleware, the metric should be decreased when the request erred or finished.
Current result
Metric does not decrease and therefore is not correct. Here a log which shows that the metric reached 81:
Possible Fix
Catch all exceptions in the
request_metricsmiddleware and decrease the metric. Then raise the exception again.