Issue
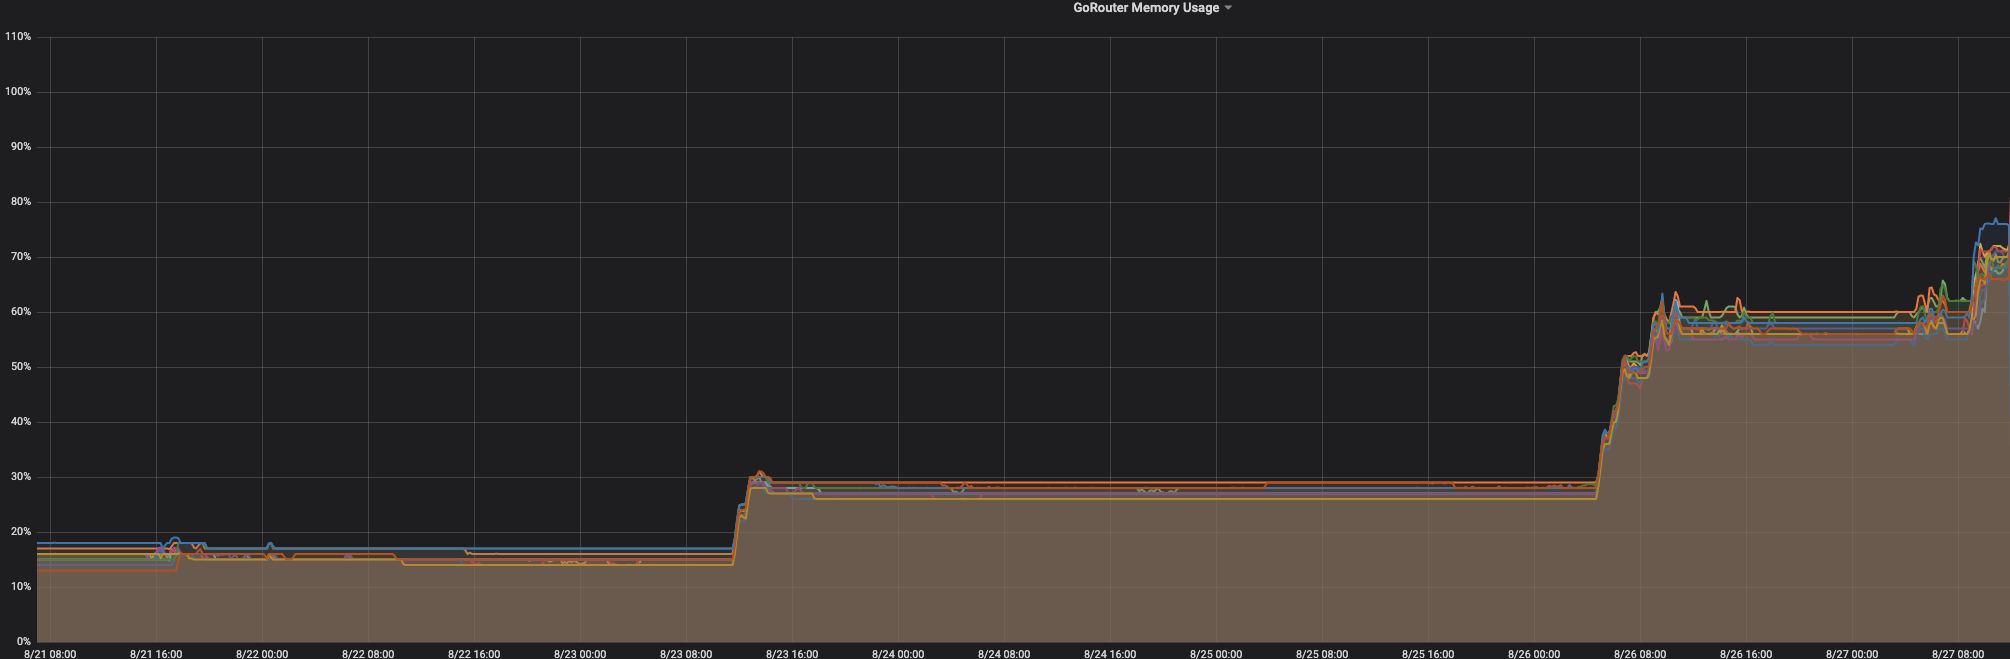
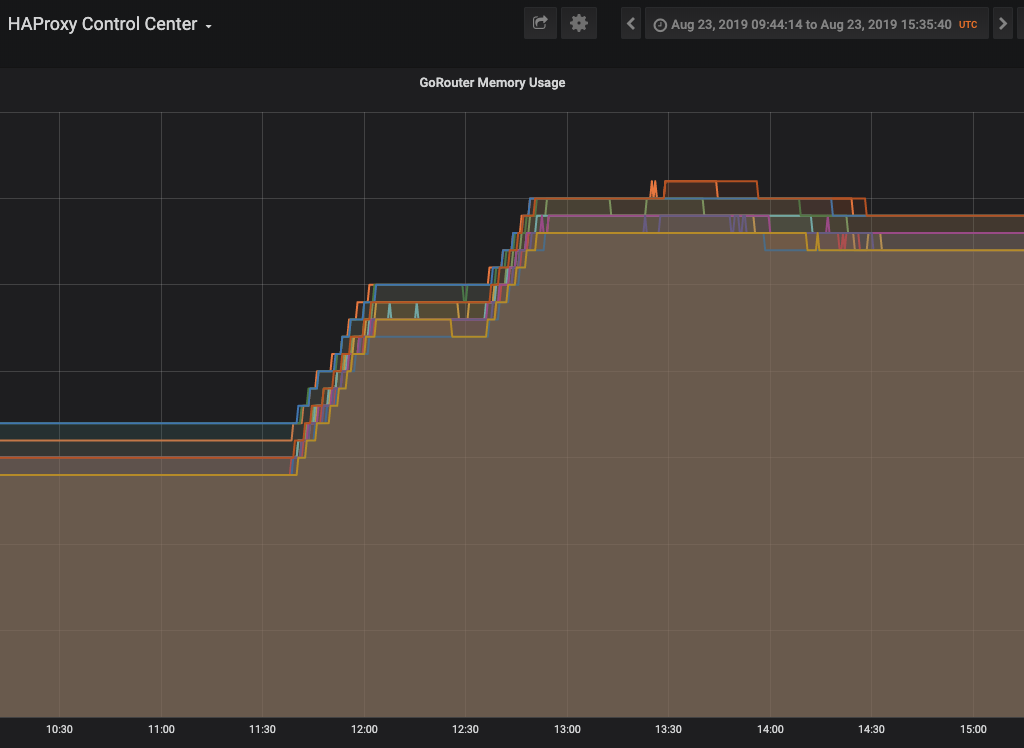
After updating to cf-deployment v11.0.0 (with route integrity enabled) on one of our productive landscapes, we have noticed an increase in the gorouter memory usage. The usage increases in steps as depicted below. It took almost a week till the usage rose to > 90%.
Context
We are using gorouter within cf-deployment ( v11.0.0, routing-release v0.190.0). SSL is not terminated on the gorouter.
The memory usage increase was not observed directly after the update to cf-deployment v11.0.0 at that time the usage was about 15%. However, two days later the usage increased to ~ 28%. The memory usage remained the same for 3 days but increased afterwards reaching almost 60%. The third increase was observed a day later to 70 %. The increase in memory doesn't correlate to the total_request nor to the total_routes.
Nevertheless, at the time when memory increases, we see many occurrences of the following error in the logs:
2019/08/27 09:52:32 httputil: ReverseProxy read error during body copy: read tcp 10.0.129.11:27892->10.0.139.165:61074: use of closed network connection
See also:
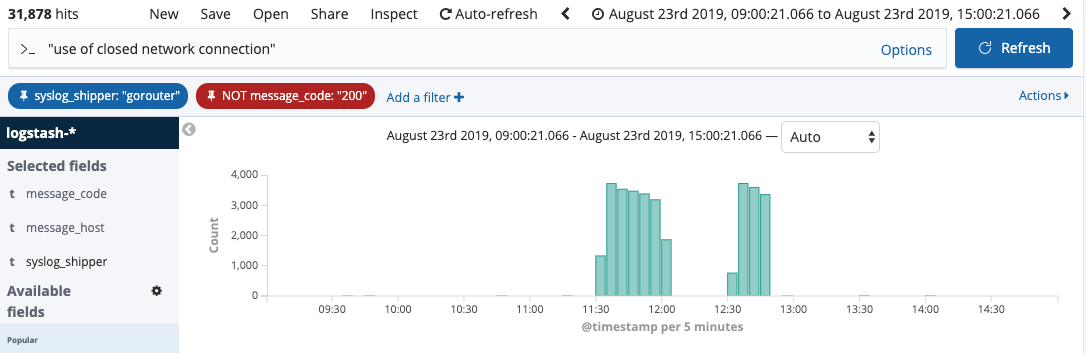
In the specified timeframe, we saw ~30.000 occurrences of the error. Each gorouter showed 2.600 errors. The error occurs while trying to connect to different diego cells.
According to the heap profile taken with pprof, 51% is consumed by bytes makeSlice tls(*Conn).readRecordOrCCS. see:
heap.txt
goroutines.txt
We have done the same update on our staging landscape before but haven't observed any memory increase. Hence, we believe that the issue is only visible with high load. In our productive setup we have 12 gorouter instances and the load ranges between 1K- 6k.
Steps to Reproduce
We didn't manage to reproduce the issue on our test landscape.
Expected result
A higher constant memory consumption due to enabling TLS routing.
Current result
Steady memory increase.
Issue
After updating to cf-deployment v11.0.0 (with route integrity enabled) on one of our productive landscapes, we have noticed an increase in the gorouter memory usage. The usage increases in steps as depicted below. It took almost a week till the usage rose to > 90%.
Context
We are using gorouter within cf-deployment ( v11.0.0, routing-release v0.190.0). SSL is not terminated on the gorouter.
The memory usage increase was not observed directly after the update to cf-deployment v11.0.0 at that time the usage was about 15%. However, two days later the usage increased to ~ 28%. The memory usage remained the same for 3 days but increased afterwards reaching almost 60%. The third increase was observed a day later to 70 %. The increase in memory doesn't correlate to the
total_requestnor to thetotal_routes.Nevertheless, at the time when memory increases, we see many occurrences of the following error in the logs:
See also:
In the specified timeframe, we saw ~30.000 occurrences of the error. Each gorouter showed 2.600 errors. The error occurs while trying to connect to different diego cells.
According to the heap profile taken with
pprof, 51% is consumed bybytes makeSlicetls(*Conn).readRecordOrCCS. see:heap.txt
goroutines.txt
We have done the same update on our staging landscape before but haven't observed any memory increase. Hence, we believe that the issue is only visible with high load. In our productive setup we have 12 gorouter instances and the load ranges between 1K- 6k.
Steps to Reproduce
We didn't manage to reproduce the issue on our test landscape.
Expected result
A higher constant memory consumption due to enabling TLS routing.
Current result
Steady memory increase.