This project was bootstrapped with Create React App.
Step 1: npx create-react-app winemart
Step 2: yarn add // to add the yarn inside our project
Step 3: yarn start // It will start the Code & will Display in Browser
Step 4: Clear the unnecessary codes & Files // remove the Unnecessary files & Codes from the React-app
Step 5: Build the Structure of Project, So it will be easy to follow next time // It helps to clear your thought & follow the plan
Step 6: Install "echart" & "echarts-for-react" // It will help to build Charts in your project/ Even you can use echartjs different version too(In this project I had used "echart" & "echarts-for-react")
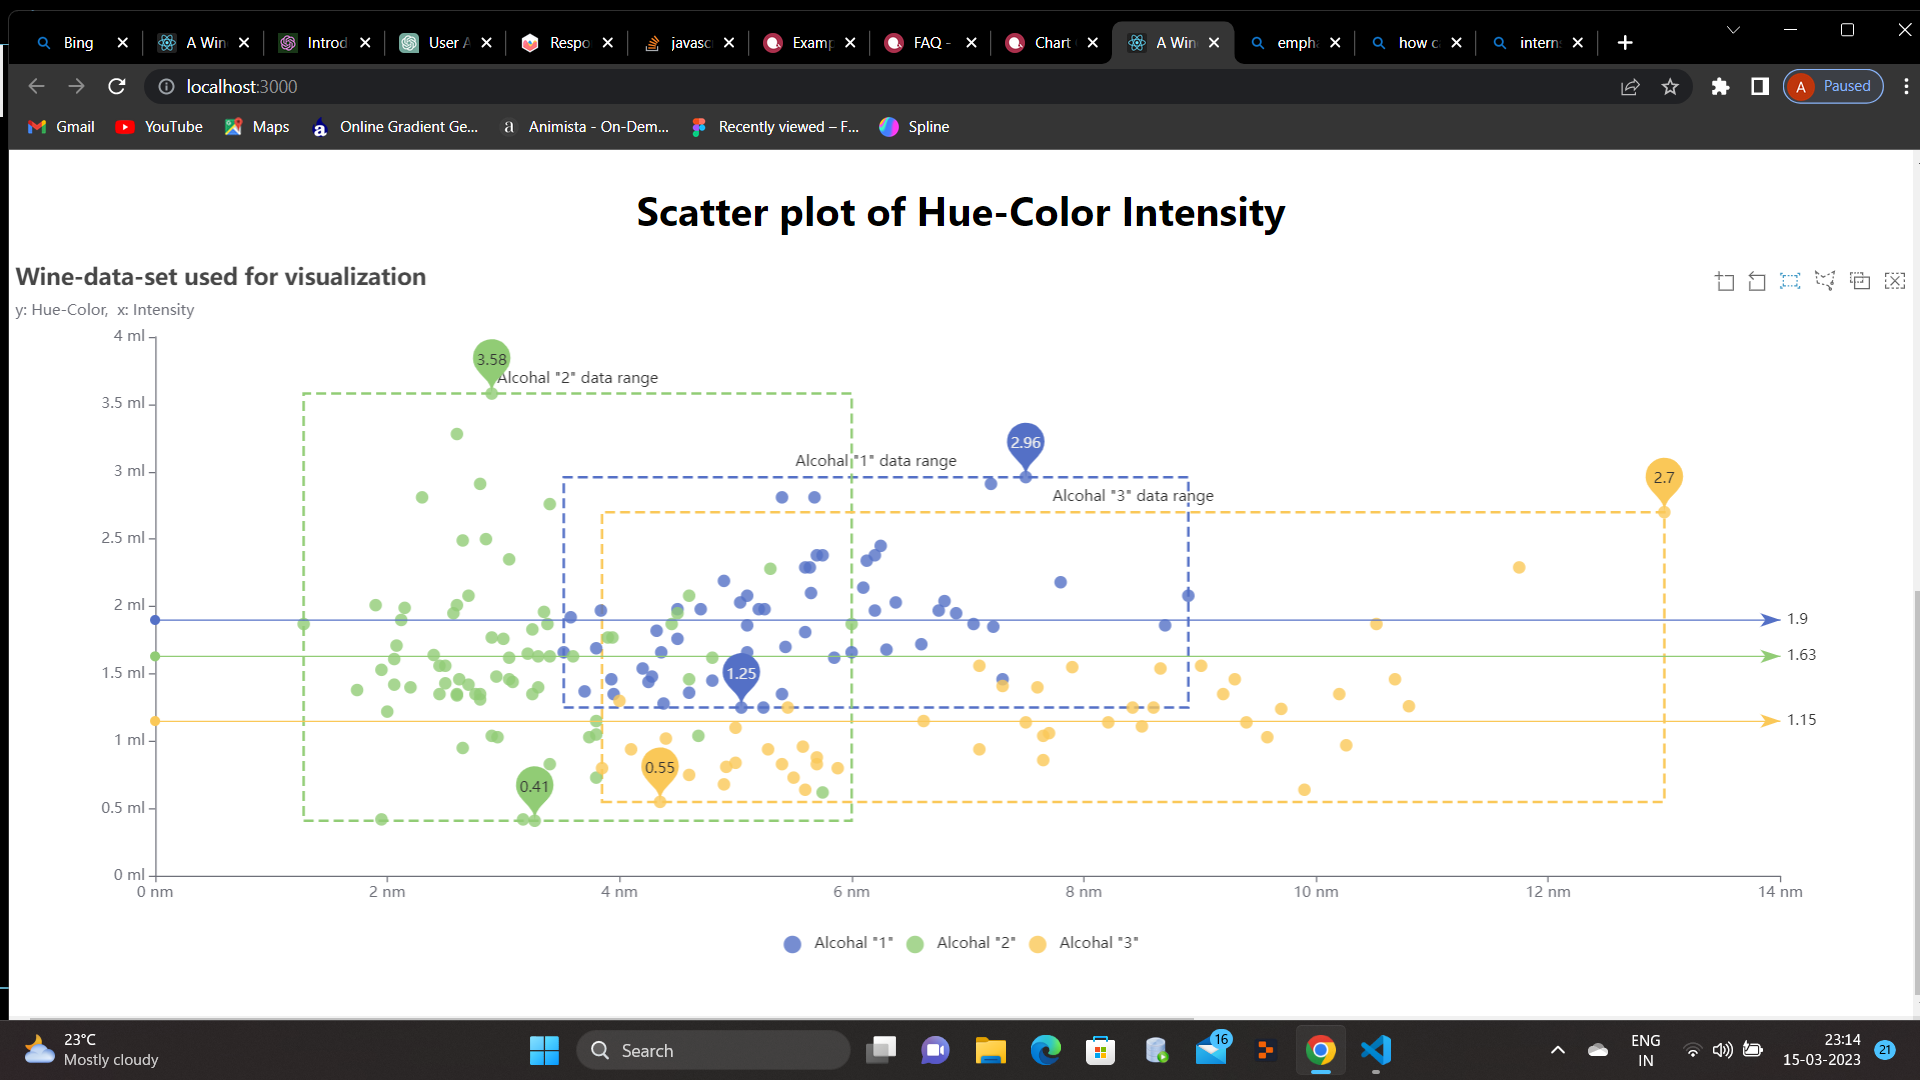
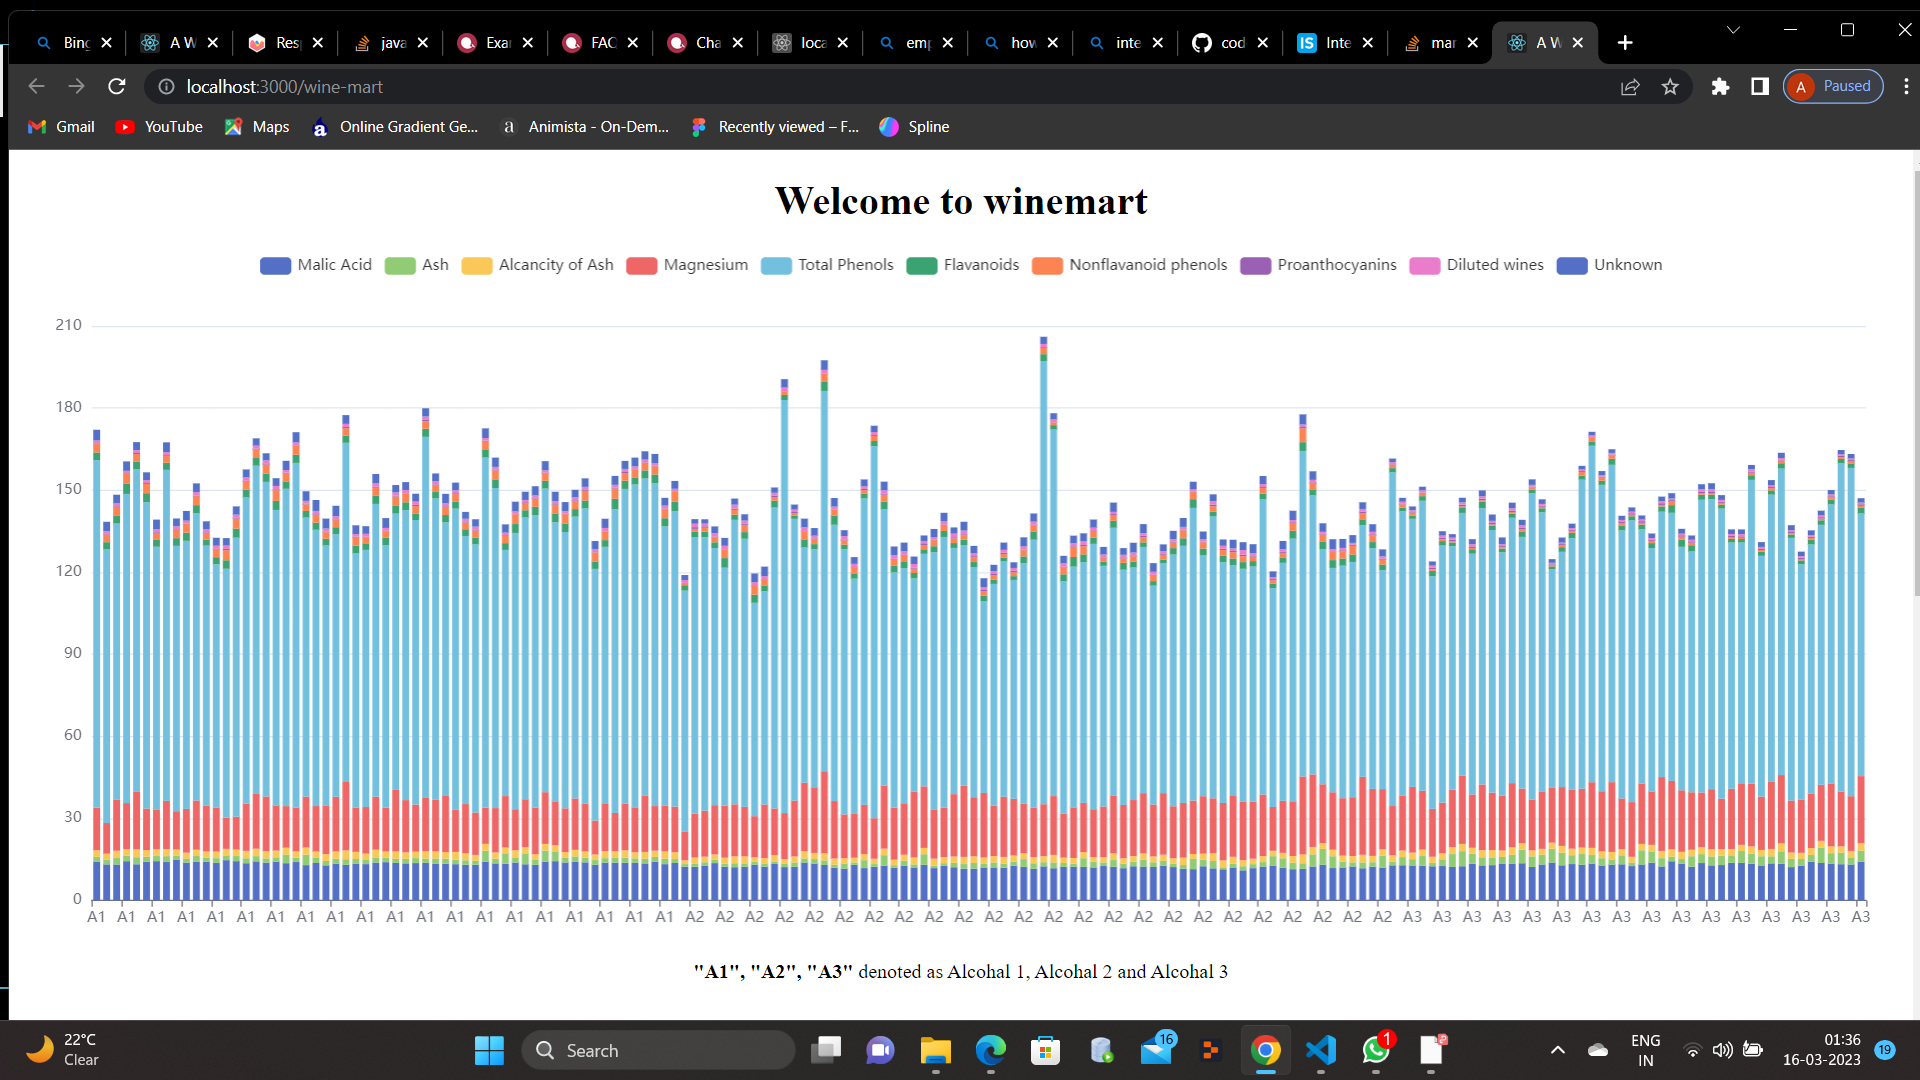
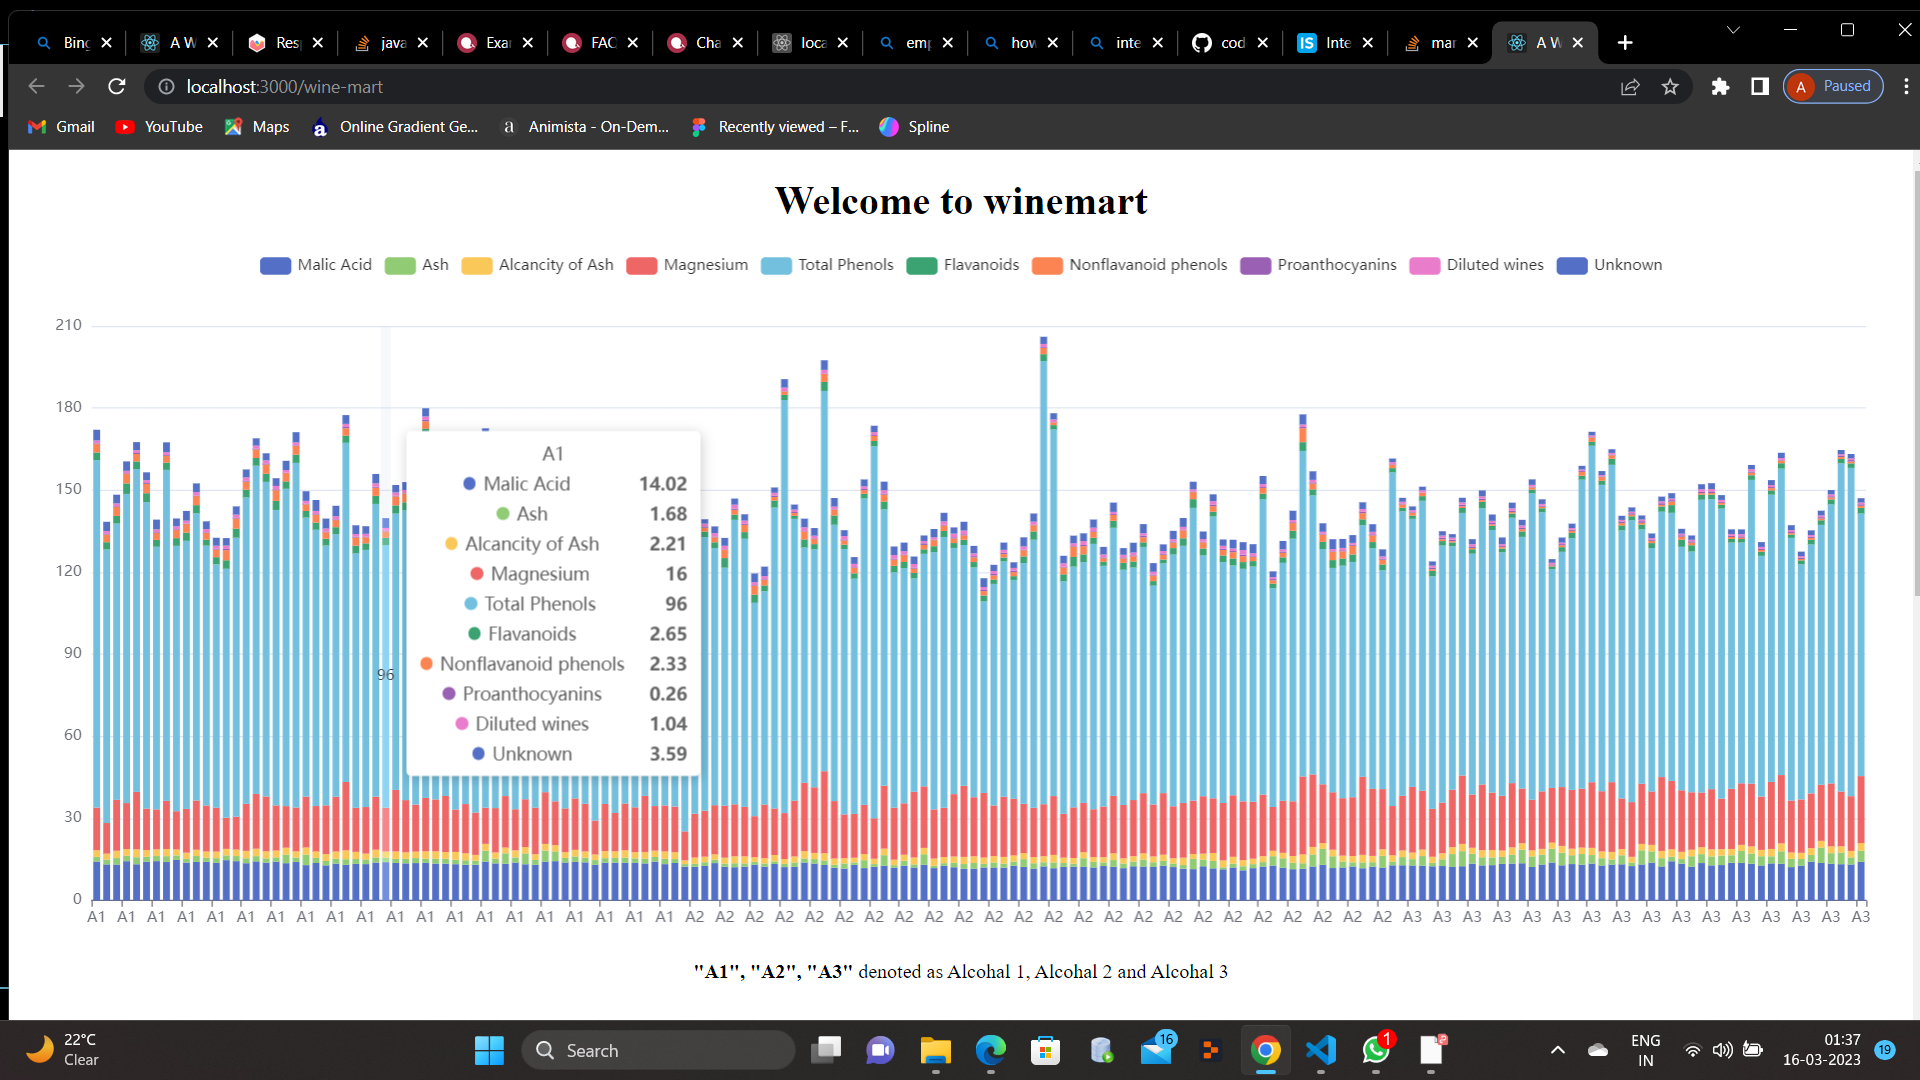
Step 7: You can either use JSON as a downloaded file inside the project or you can fetch it as a API // In my case I downloaded the file & used as a file named "Wine-data.json".
Step 8: Fetched the JSON data as per requirement // Basically I used JSON.map() to retrieve the data
Step 9: Once all the data fetched you are all set to go for Chart representaion // Build the chart as per given data in "Apache ECharts" and insert the retrieved data as per requirement specially in Array format.
Step 10: Once the Bar Chart & Scatter Plot Chart Completed // You can Style a bit of Increasing the Size() or Decreasing the size() as per your Screen
Step 11: Deploy the project on GitHub as well as GitHub pages // To able to catch your website on Online
This section has moved here: https://facebook.github.io/create-react-app/docs/deployment
This section has moved here: https://facebook.github.io/create-react-app/docs/troubleshooting#npm-run-build-fails-to-minify