Worker dashboard: More tooltip information on peer comms#5230
Worker dashboard: More tooltip information on peer comms#5230
Conversation
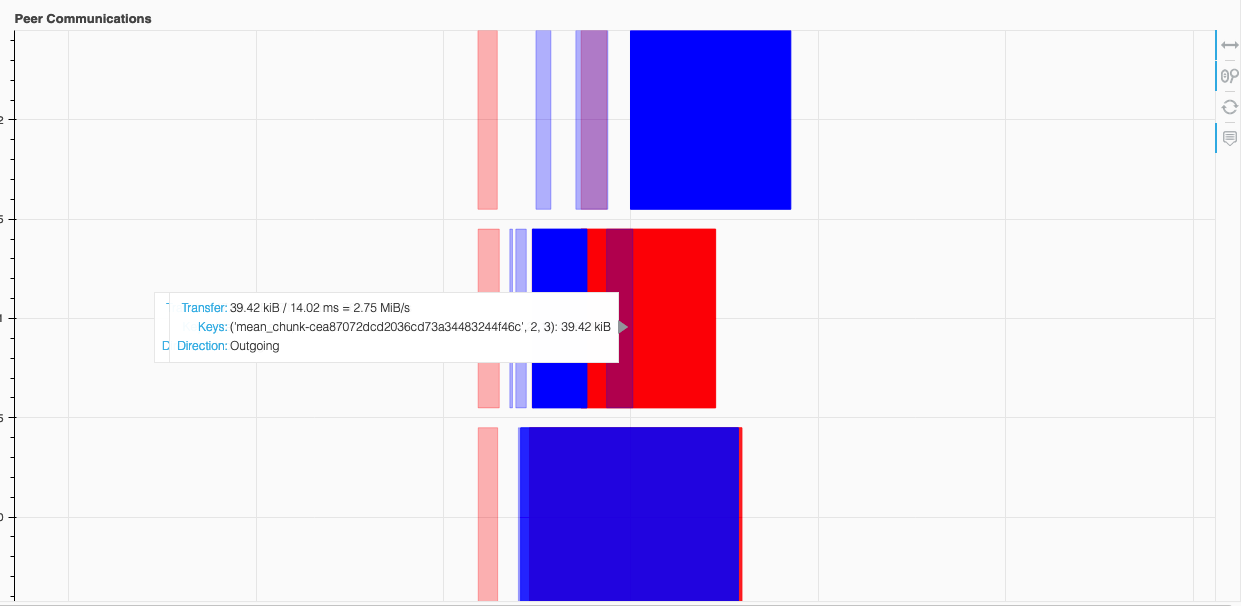
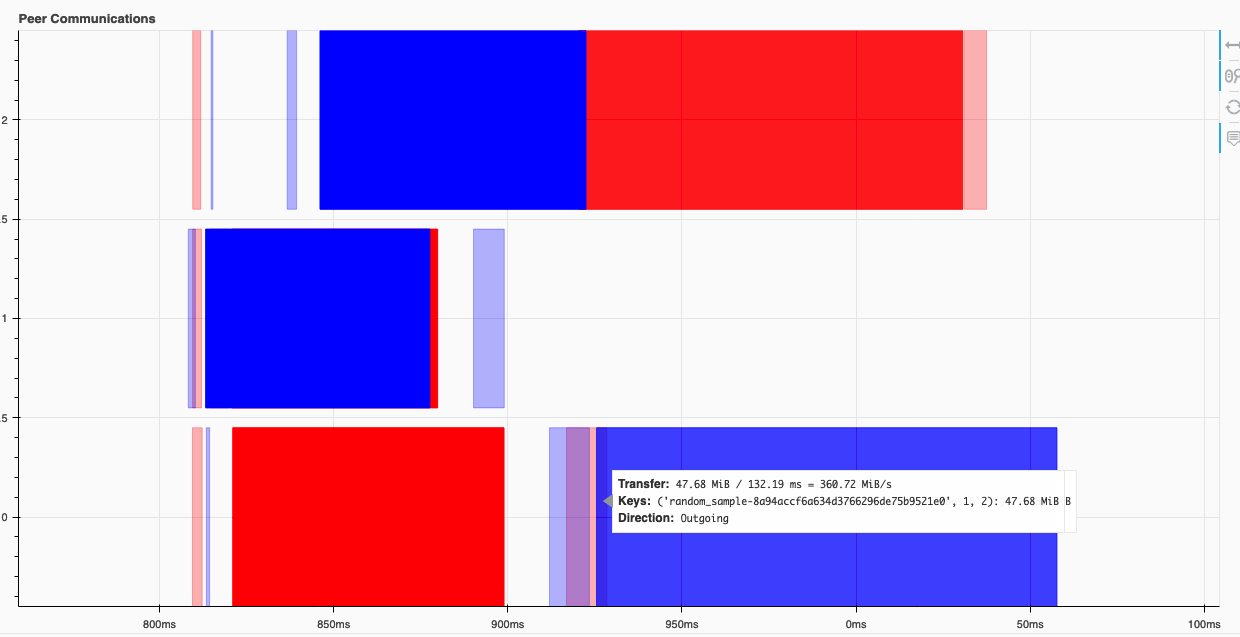
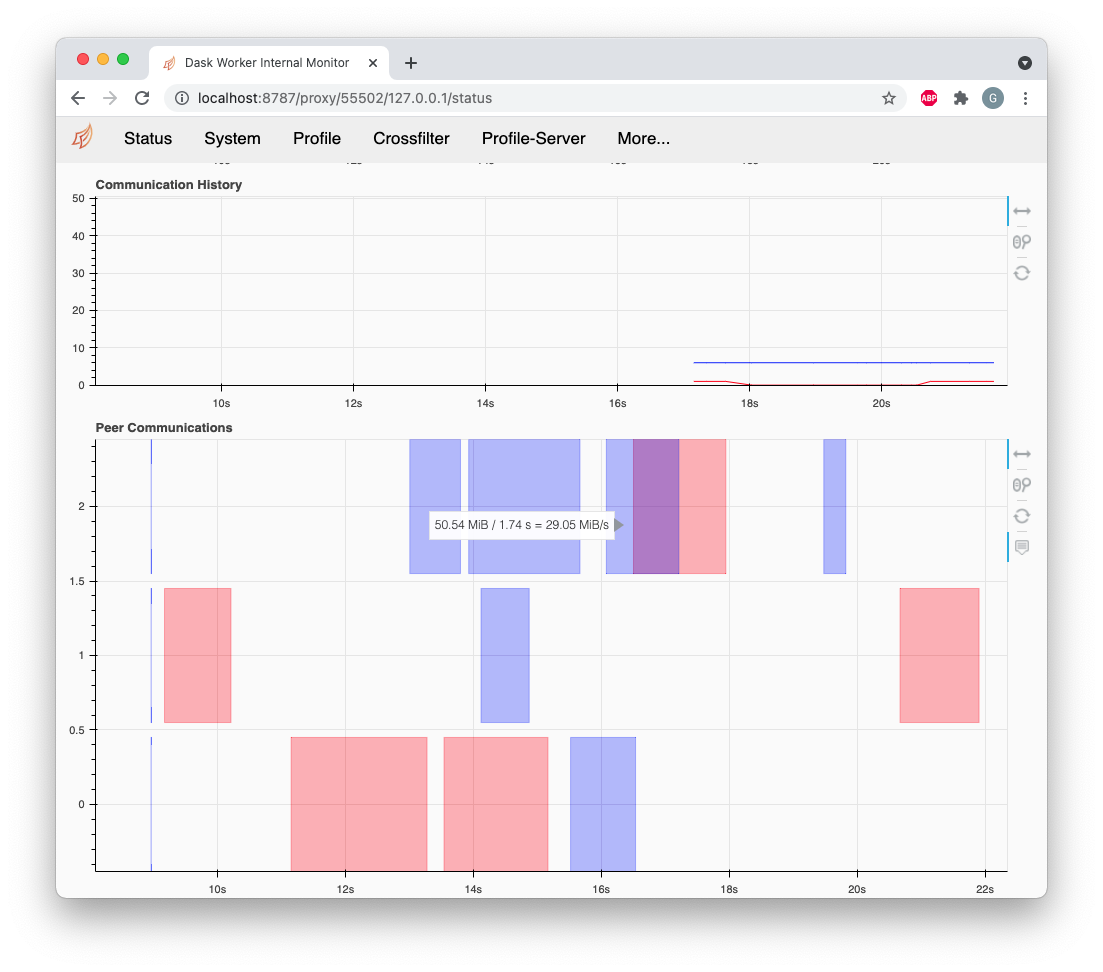
Show the name(s) of the keys being transferred, and their sizes, in the tooltop. Also show the transfer direction—knowing what blue vs read means is unintuitive at first.
 jrbourbeau
left a comment
jrbourbeau
left a comment
There was a problem hiding this comment.
Thanks for the update and screenshots @gjoseph92! cc @ncclementi if you get a chance to take a look at this
|
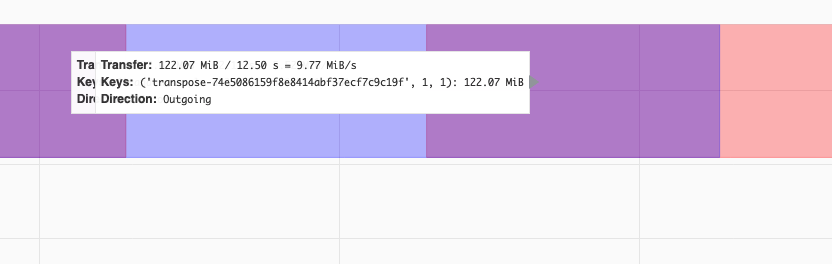
Thanks for the update @gjoseph92 I have a few comments and some suggestions. I noticed that in some cases the hovers overlap, for example here. I'm not sure what's the best way of handling this but we might be missing some info due to the overlap.
|
| ) | ||
|
|
||
| hover = HoverTool(point_policy="follow_mouse", tooltips="""@hover""") | ||
| hover = HoverTool( |
There was a problem hiding this comment.
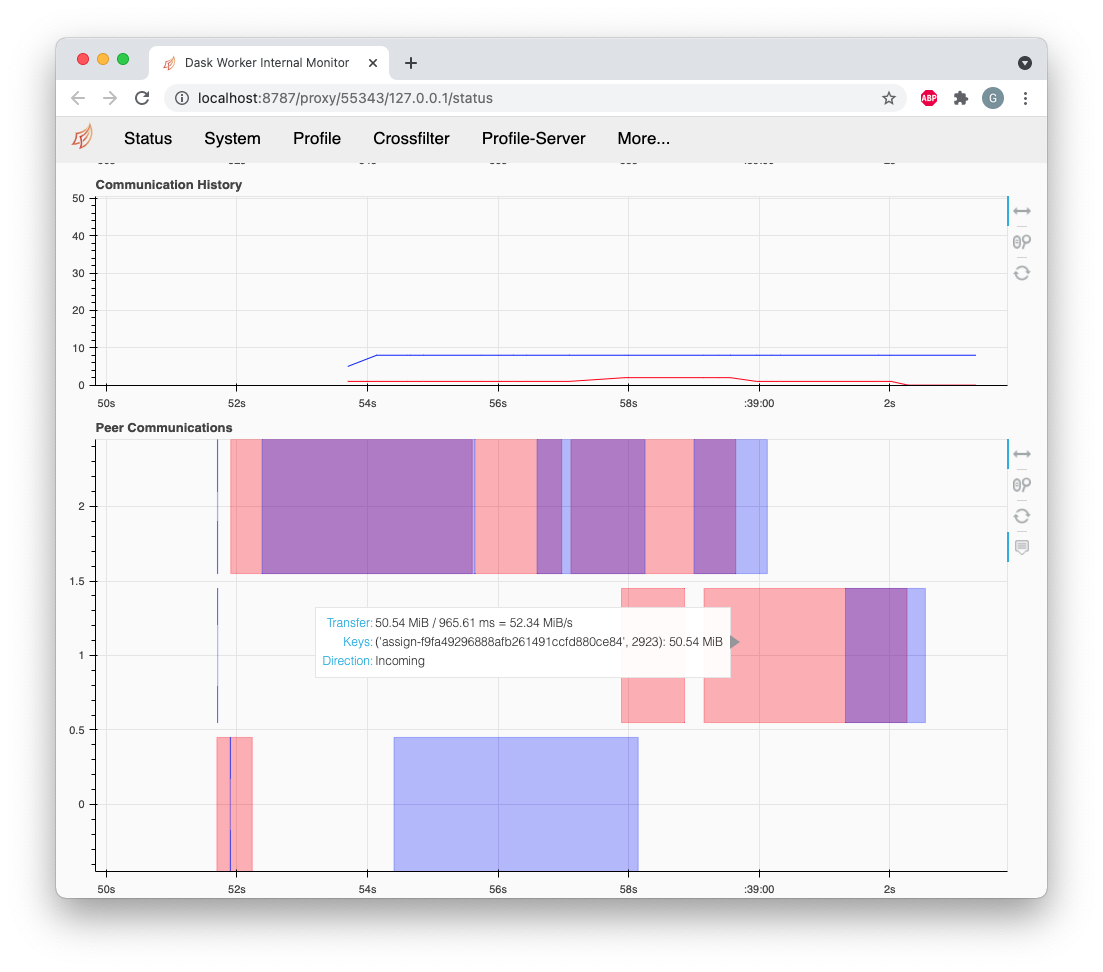
Most of the hovers now have a different format, which looks like this:
This are the changes to make it consistent : )
diff --git a/distributed/dashboard/components/worker.py b/distributed/dashboard/components/worker.py
index e3e879c7..1840b3a7 100644
--- a/distributed/dashboard/components/worker.py
+++ b/distributed/dashboard/components/worker.py
@@ -157,12 +157,22 @@ class CommunicatingStream(DashboardComponent):
hover = HoverTool(
point_policy="follow_mouse",
- tooltips=[
- ("Transfer", "@transfer"),
- ("Keys", "@keys{safe}"),
- ("Direction", "$name"),
- ],
+ tooltips="""
+ <div>
+ <span style="font-size: 12px; font-weight: bold;">Transfer:</span>
+ <span style="font-size: 10px; font-family: Monaco, monospace;">@transfer</span>
+ </div>
+ <div>
+ <span style="font-size: 12px; font-weight: bold;">Keys:</span>
+ <span style="font-size: 10px; font-family: Monaco, monospace;">@keys{safe}</span>
+ </div>
+ <div>
+ <span style="font-size: 12px; font-weight: bold;">Direction:</span>
+ <span style="font-size: 10px; font-family: Monaco, monospace;">$name</span>
+ </div>
+ """,
)
+
fig.add_tools(
hover,
ResetTool(),|
@gjoseph92 Since we are already modifying the worker's status page, I noticed that the timeseries plot doesn't have labels. If the colors indicate "Incoming" and "Outgoing" too, would you mind adding the labels here? (please note that I assumed that red is incoming and blue outgoing, but correct me if I'm wrong.) distributed/distributed/dashboard/components/worker.py Lines 237 to 239 in b0eefbd In a diff, this would look like (label set to the left, to prevent blocking most recent readings) diff --git a/distributed/dashboard/components/worker.py b/distributed/dashboard/components/worker.py
index e3e879c7..c830bc03 100644
--- a/distributed/dashboard/components/worker.py
+++ b/distributed/dashboard/components/worker.py
@@ -246,9 +246,10 @@ class CommunicatingTimeSeries(DashboardComponent):
x_range=x_range,
**kwargs,
)
- fig.line(source=self.source, x="x", y="in", color="red")
- fig.line(source=self.source, x="x", y="out", color="blue")
+ fig.line(source=self.source, x="x", y="in", color="red", legend_label="Incoming")
+ fig.line(source=self.source, x="x", y="out", color="blue", legend_label="Outgoing")
+ fig.legend.location = "top_left"
fig.add_tools(
ResetTool(), PanTool(dimensions="width"), WheelZoomTool(dimensions="width")
)
|
|
@gjoseph92 checking in here. Is this something you are still looking into? |
|
Hey thanks for checking in. Thanks for the suggestions, never got around to it since I stopped using this dashboard. If I get the time to this week maybe I can follow up. |
Thanks for the example; I didn't know how to do this
|
@ncclementi I made your changes here, thanks! |
|
@gjoseph92 thanks for adding those. This is looking good to me!
|
|
Separate note, we have a problem with hovers overlapping but this problem existed before the changes of this PR so I would leave it for a separate PR. But I'm not sure how we can fix this, it seems to be on bokeh's end. @bryevdv do you have any ideas on how to go about this?
|
|
@ncclementi ability to filter down the number of tooltips dispayed is still an open issue bokeh/bokeh#9087 I seem to recall someone on SO or another forum may have found some hacky CSS workaround to just have one visible, but I have not been able to find the reference. I've re-triaged the issue to A separate issue would be some kind of visual dodge for tooltips but that is probably more work. Offhand, the immediate workaround would be not not use hover tooltip at all. Instead use a hover callback to update an informational |
Show the name(s) of the keys being transferred, and their sizes, in the tooltop. Also show the transfer direction—knowing what blue vs read means is unintuitive at first.
After:
Before:
black distributed/flake8 distributed/isort distributed