-
Notifications
You must be signed in to change notification settings - Fork 8
6. Observational appearance
David A Roberts edited this page Dec 2, 2015
·
1 revision
Theoretical models predict both line and continuous electromagnetic spectra of accretion discs. Comparison with observations shows a rather good general agreement. However, several details are not satisfactory fitted and others are fixed by empirical ad hoc assumptions. Generally, the radiative transfer through the disc is not treated as accurately as in the case of stellar atmospheres. The two most acute difficulties that one faces in the accretion disc case are: (a) the disc geometry calls for a 3-D treatment of the problem, (b) the viscous energy generation rate is not known as a function of the position in the disc. Fundamental papers that discuss methods to deal with these difficulties: ????; see also ????. In the black hole and neutron star accretion discs, the fact that radiation moves in a highly curved space (spacetime) further complicates the problem of calculating the spectra. Several "ray tracing" methods of calculating have been developed to deal with this issue; see ???? and ????. Jean-Alain Marck was a pioneer of the modern methods in the ray tracing.
The protoplanetary discs appear in the spectra of young stellar objects as infra-red excess on top of a stellar blackbody signature. Depending on the stage of the system, the excess hump can dominate (class I) the emission profile or is barely notable (class III). Protoplanetary discs contain a large amount of dust, e.g., silicates, minerals or water, whose chemical composition and geometrical shape show up as a forest of line features in the spectrum and greatly influence the opacity and evolution of the disc (Dullemond & Dominik, 2005).
The Cataclysmic Variables (CVs) with accretion discs (i.e., the WD is not or only weakly magnetised) can be of very different types. The classical or recurring novae discs show a stupendous variation of luminosity during the outburst phase from hundreds to billions times the original disc luminosity (the larger the outburst amplitude, the faster the nova fades). Moreover, collimated jets may emanate from their central regions. The dwarf novae discs are controlled by a temporary enhancement of the rate of mass transfer. The dust or debris discs resulting from tidally disrupted asteroids are usually cold and underluminous. Generally, discs of CVs are divided into two states:
- the high state (high luminosity, active mass-transfer)
- the low state (low luminosity, quiescent)
- the very high state (very luminous)
- the thermal state (disc dominated, luminous, high/soft state),
- the intermediate state
- the power-law state (slightly less luminous, low/hard state with strong variability) ,
- the quiescent state (very underluminous).
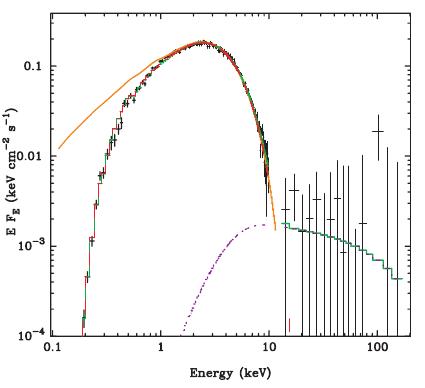
The BeppoSAX observation of LMC X-3 in the thermal (high/soft) state in comparison with the best fit BHSPEC models (for inclination i = 67°, distance D = 52 kpc and viscosity prescription <math>\alpha = 0.01</math>). The total model is given by the green curve, BHSPEC (red, long-dashed curve) and COMPTT (violet, short-dashed curve) are plotted model components. The unabsorbed BHSPEC model is shown by the orange, solid curve.
Figure credits: Davis et al. (2006)
500px
The observed low-state spectrum of the X-Ray Nova XTE J1118+480 (crosses, triangels and squares) compared with the two spectra calculated with the adaf model (red and green lines). Figure taken from Esin et al. (2001)
Image:slim-disk-spectra-netzer.gif
The soft hump and hard X-ray spectrum of RE J1034+396. The data are taken from
Puchnarewicz et al., 2001. The dashed, solid and dotted lines represent slim disc models with <math>{\dot M}/{\dot M}_{Edd} =</math> 5, 10, and 20 respectively. In all cases the central black hole has the mass <math>2.25 \times 10^6 M_{sun}\ .</math> The fits include Comptonization.
Figure taken from Wang & Netzer, 2003.
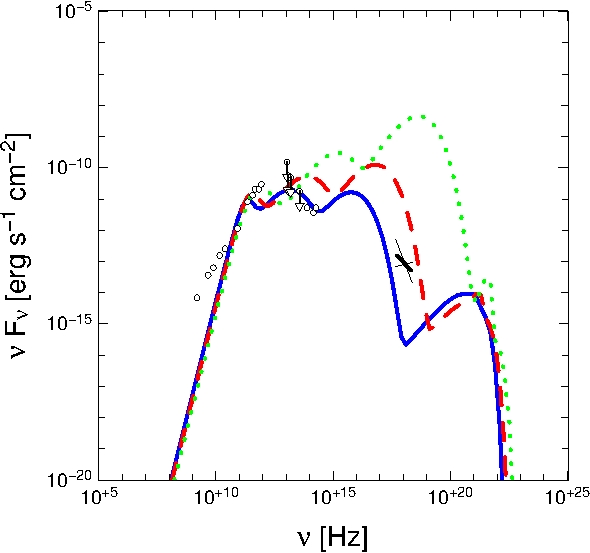
Impact of spin on an ion torus spectrum: a = 0 (solid blue), 0.5M (dashed red) or 0.9M (dotted green). The open circles and the "bow tie" mark observational data of Sgr A*. Note that this is merely a comparison: the spectra do not represent best fits.
Figure taken from Straub et al., 2012
</td></tr></table>
</td></tr></table>
| Image:Iron-line-ngc-3516-nandra.gif |
The iron line profile for the accretion disc in NGC 3516. The solid line shows the best fit model for an accretion disk around a rotating black hole, with an absorption line—presumably also due to iron but redshifted—in the low-energy wing of the line. This provides a better fit to the data than a line from the disk line alone (dotted line), even when an additional narrow component is allowed (dashed line). Inset shows the line profile from the parts of the observation ( where this absorption feature was found to be the strongest. The arrow marks its location. Figure source: Nandra et al. 1999.
|
| > PREVIOUS SECTION 5. Numerical simulations | > FIRST SECTION Scholarpedia Accretion discs | > NEXT SECTION 7. Fundamental unsolved problems |