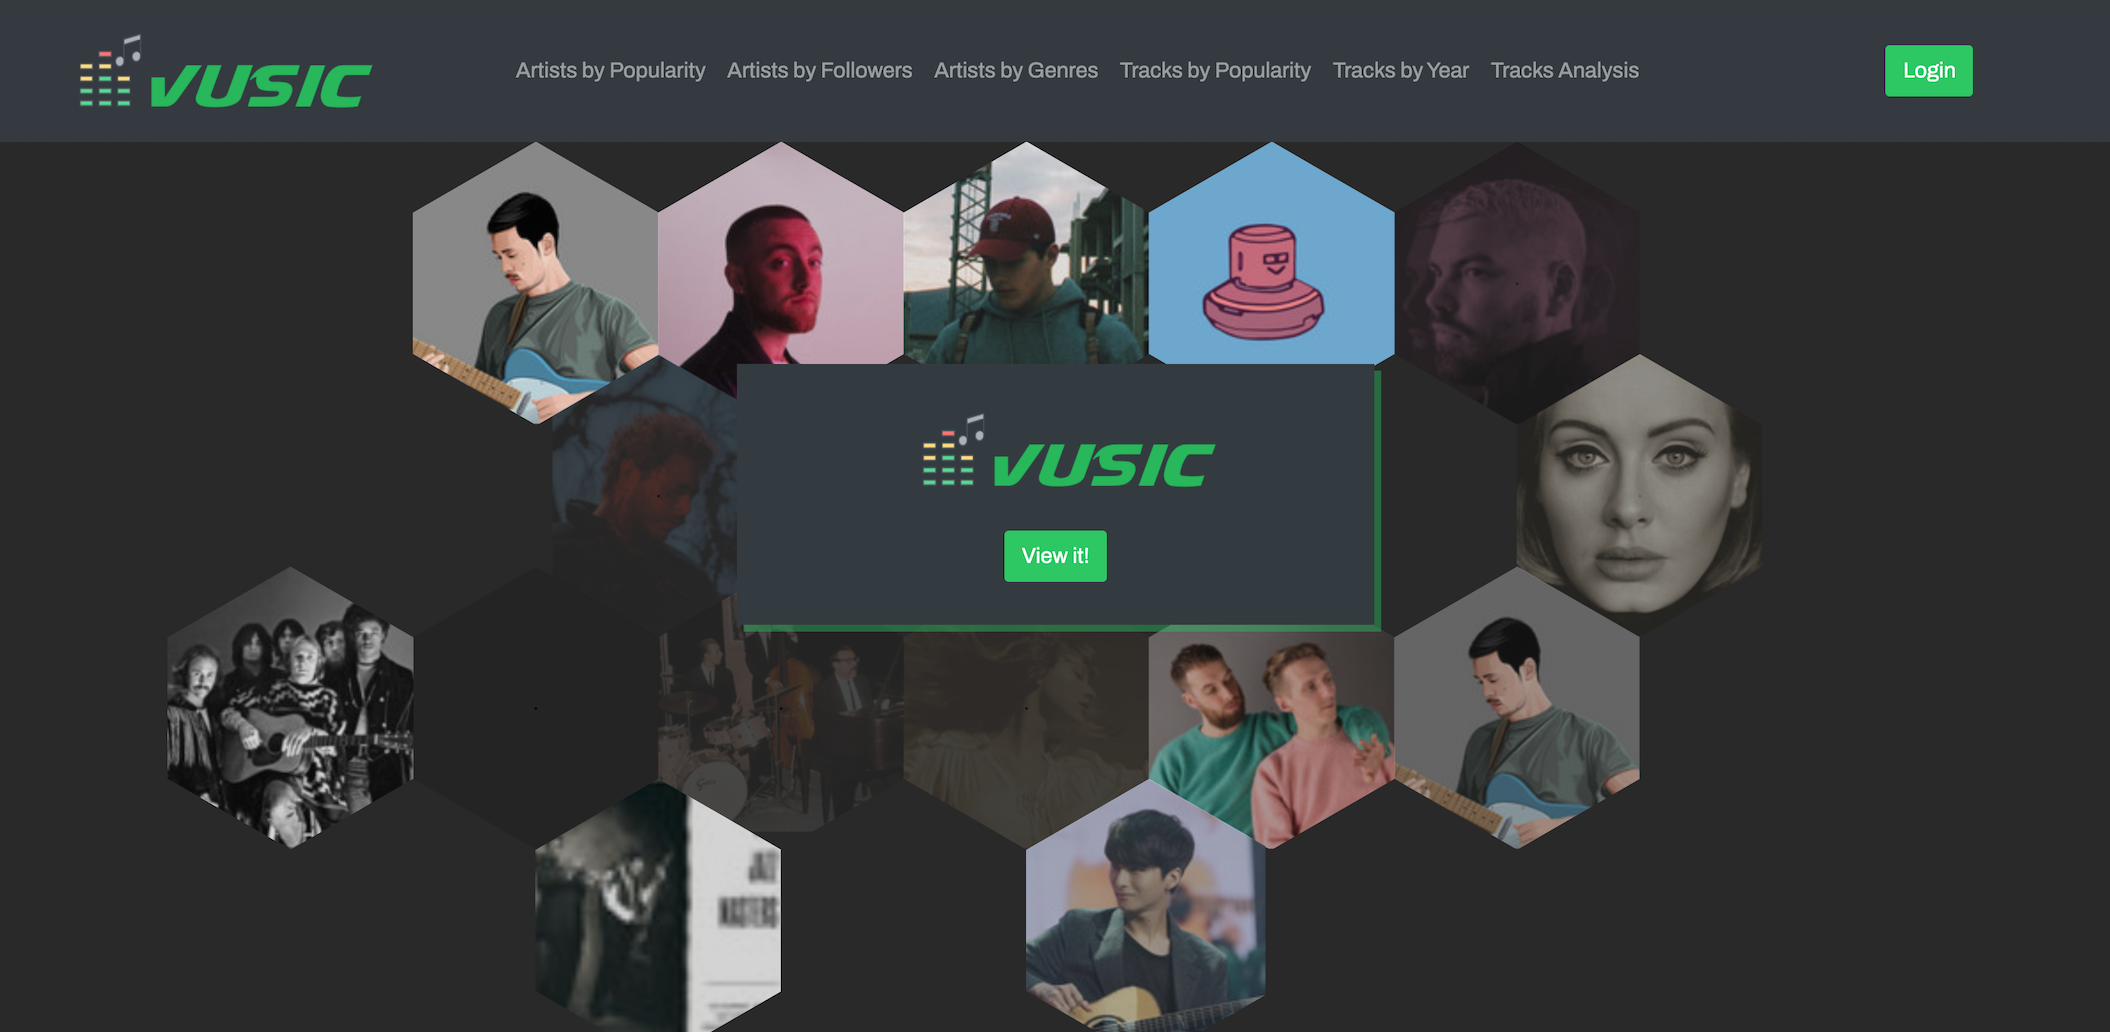
Why wait until the end of the year for Spotify to send you your listening data? You could have it all in the palm of your hand today! Vusic allows you visualize your Spotify account's listening data with a click of a button.
Created by Jiaqi Liu, Neerav Patel, David Claveau
Prompts user to login to their Spotify account to fetch user data.
Bubble graphs show top artists and tracks in popularity, as well as each artist's followers.
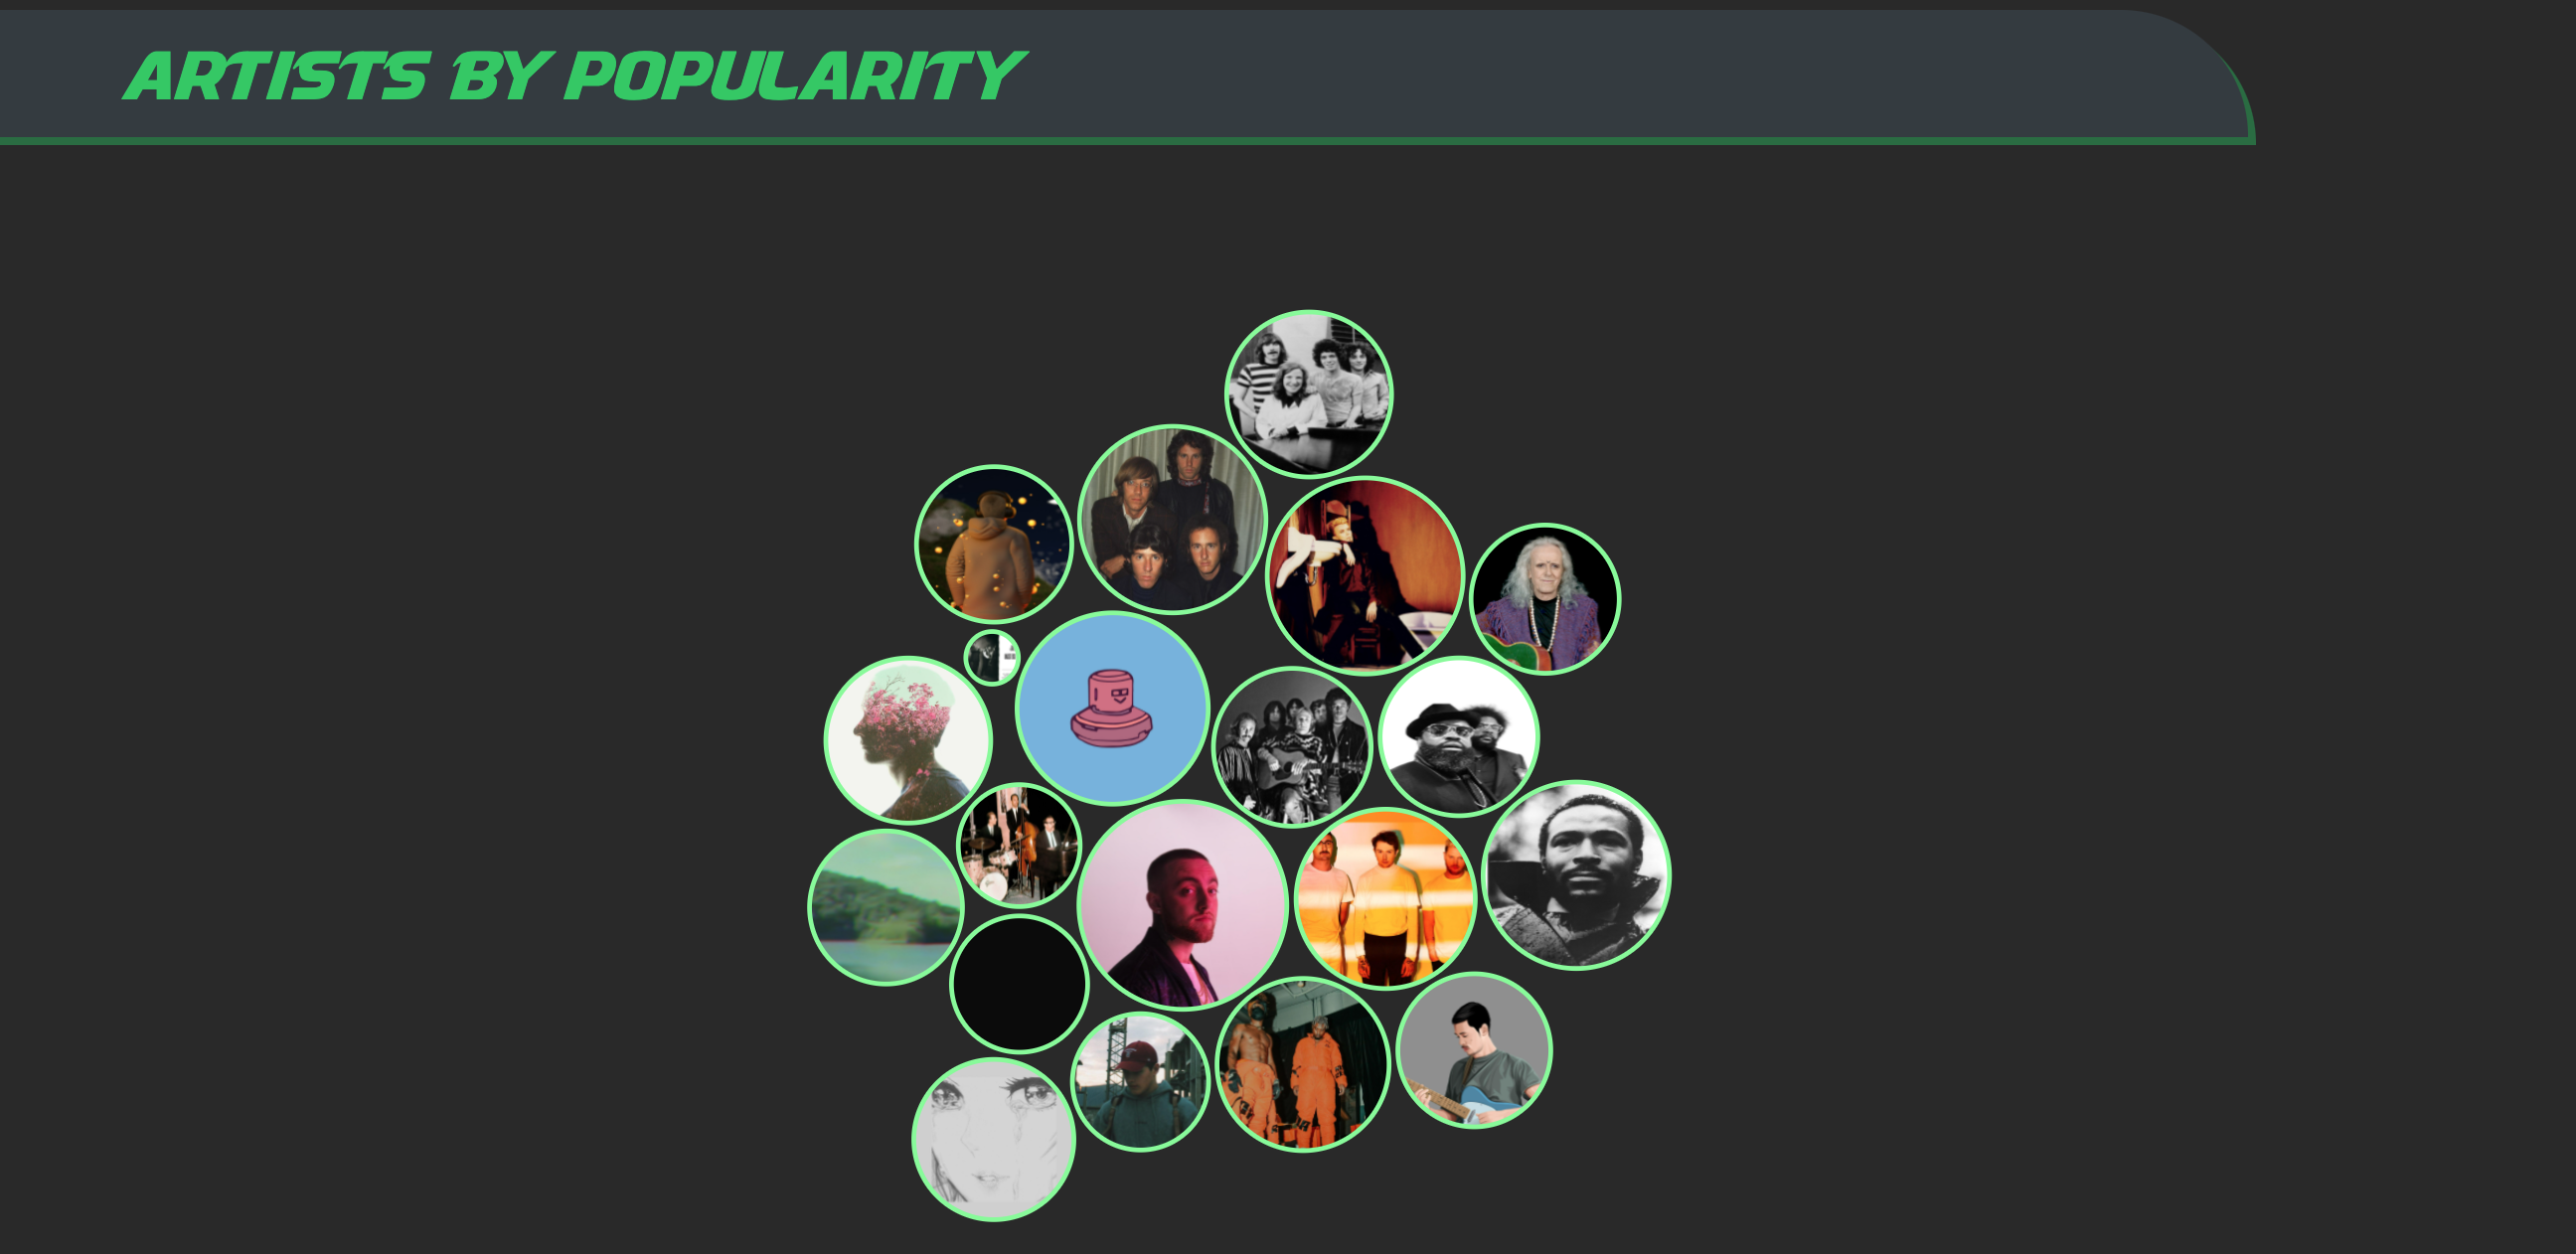
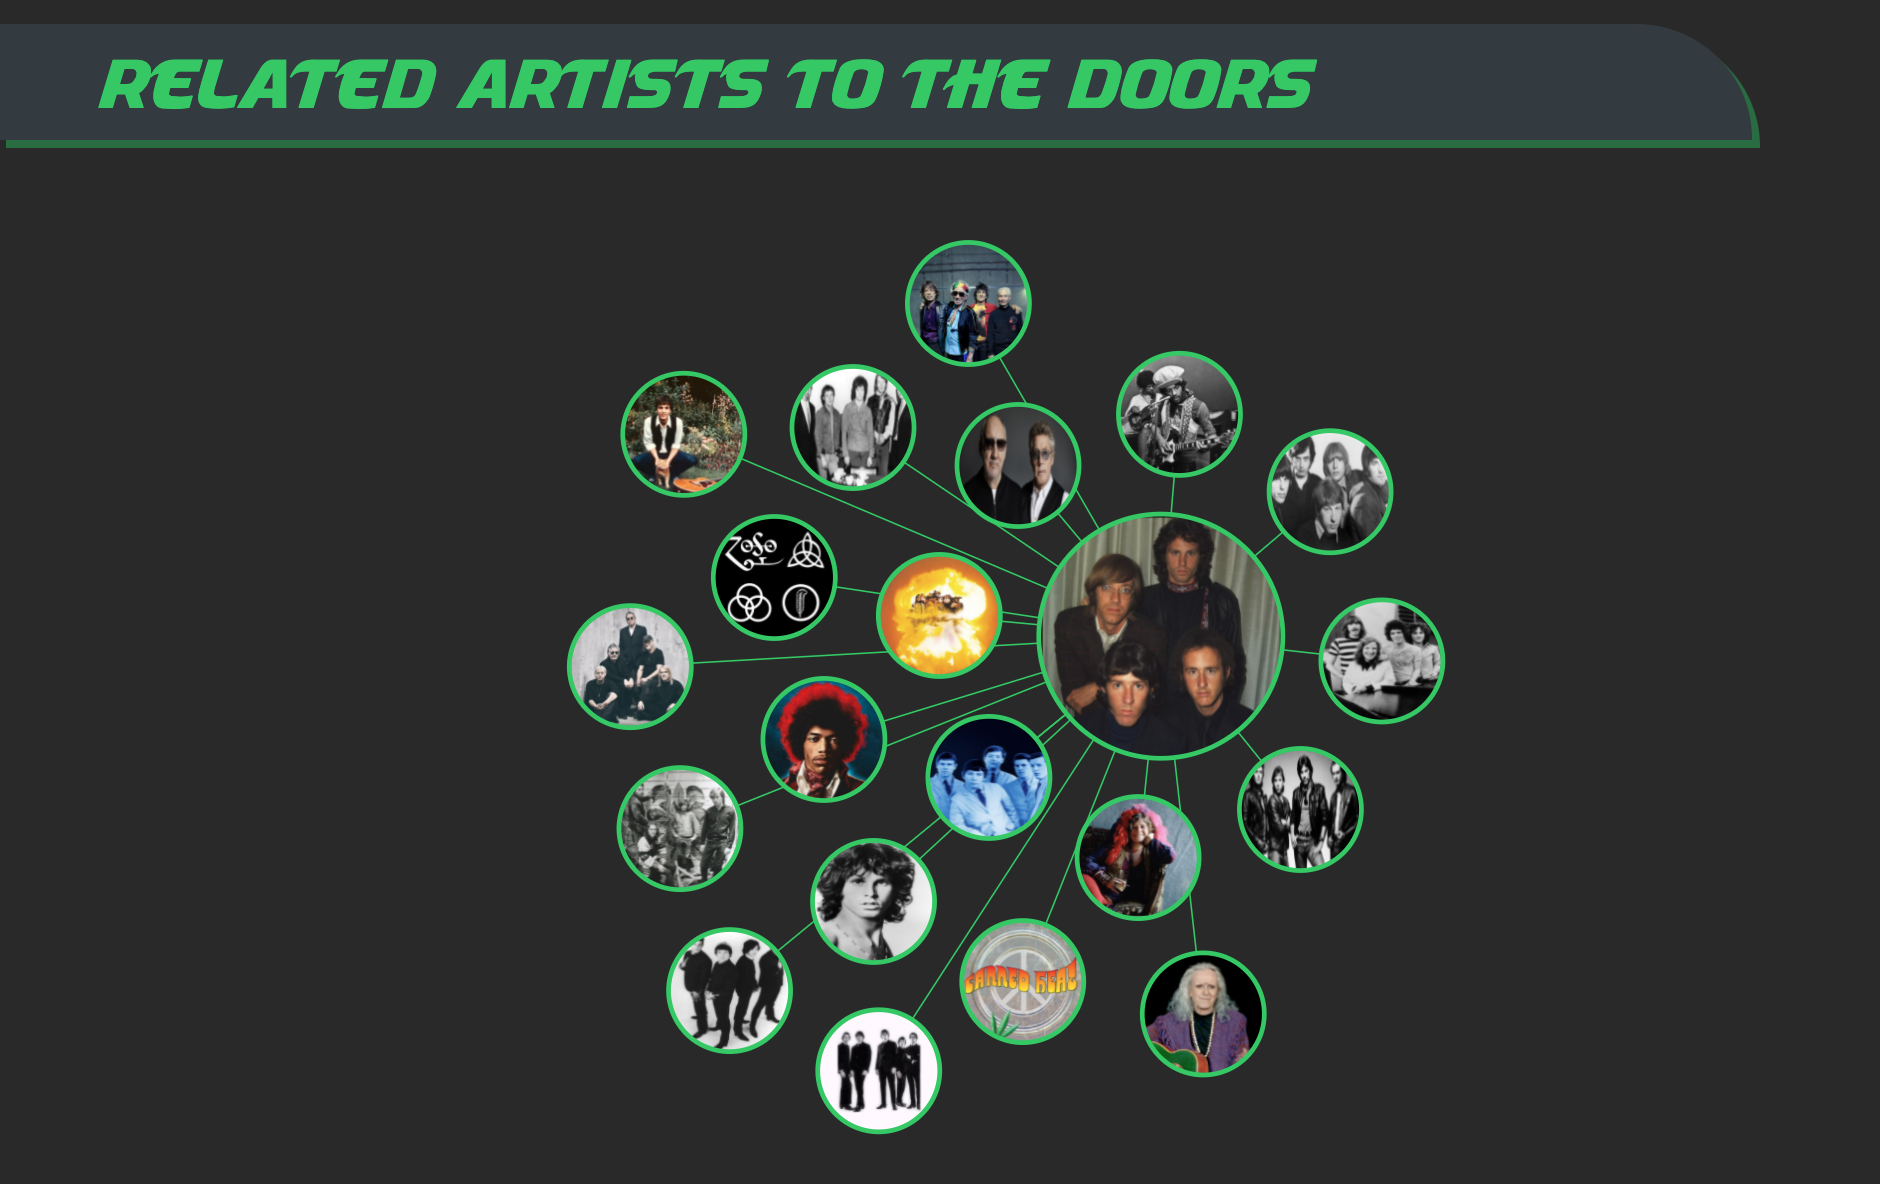
Selecting an artist will show related artists as well!
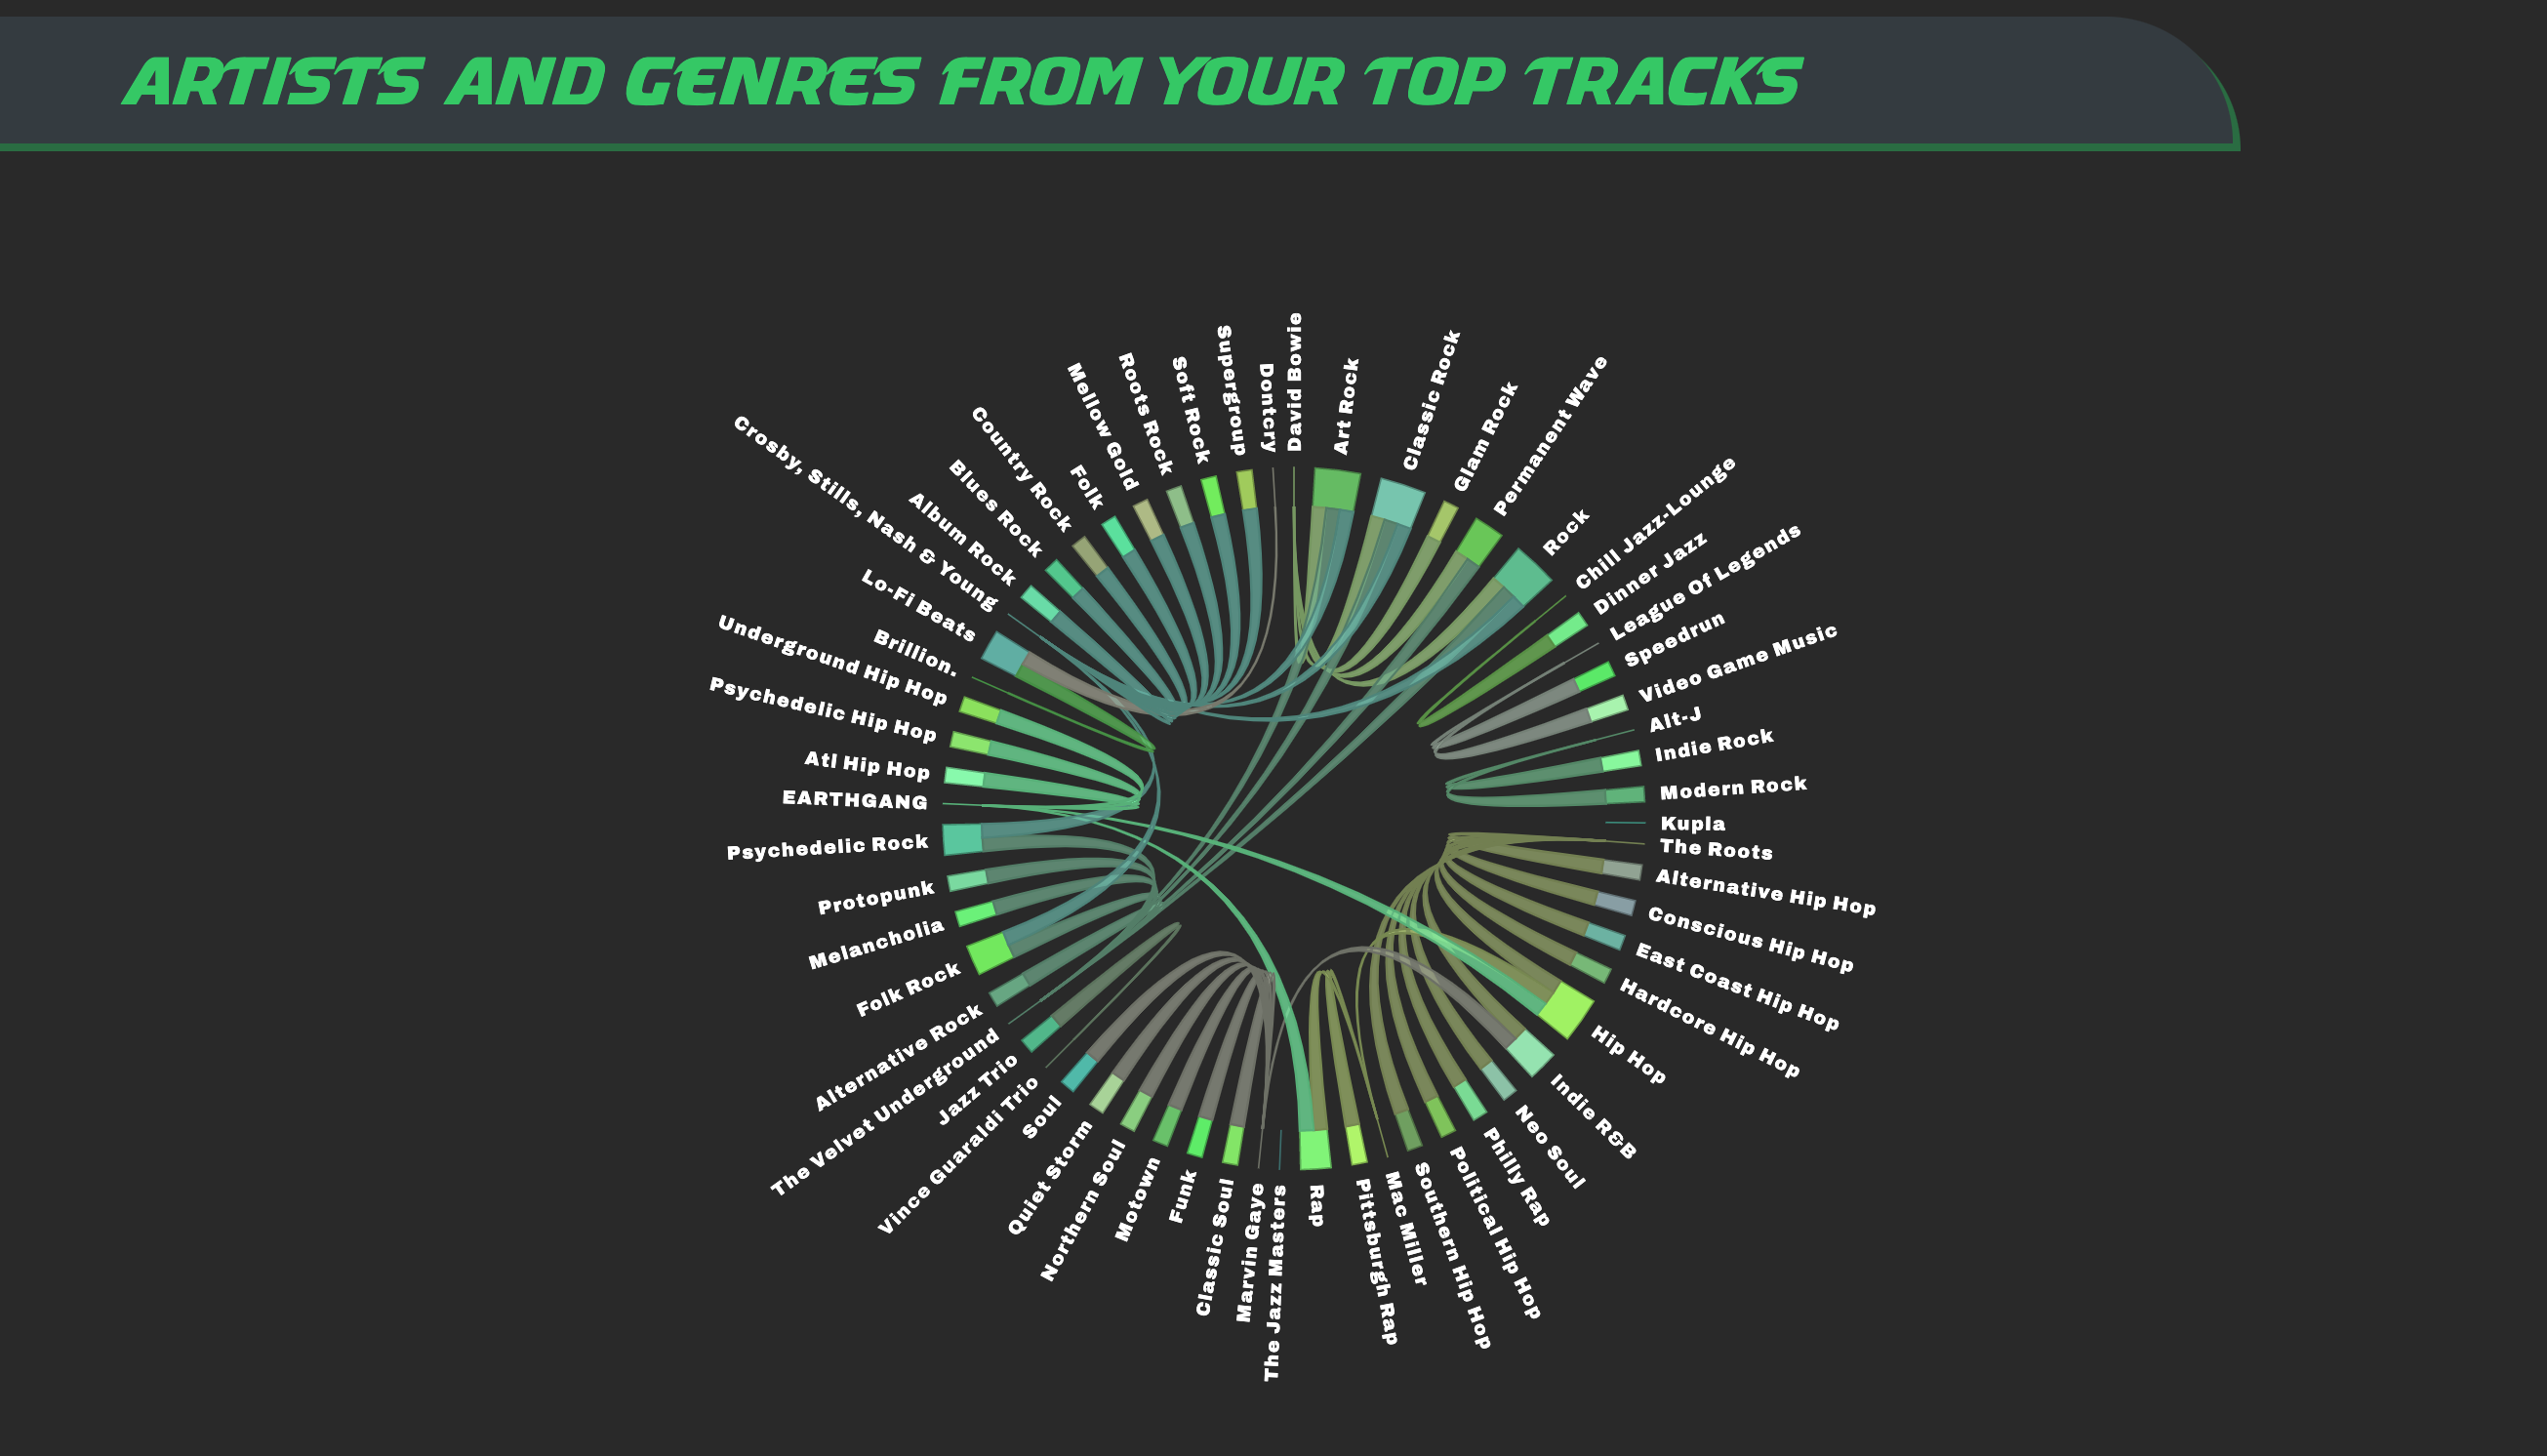
An interactive chord chart plots the user's top artists and each artist's genres. Shows correlations in top artists' genres and Spotify's eclectic genre pool.
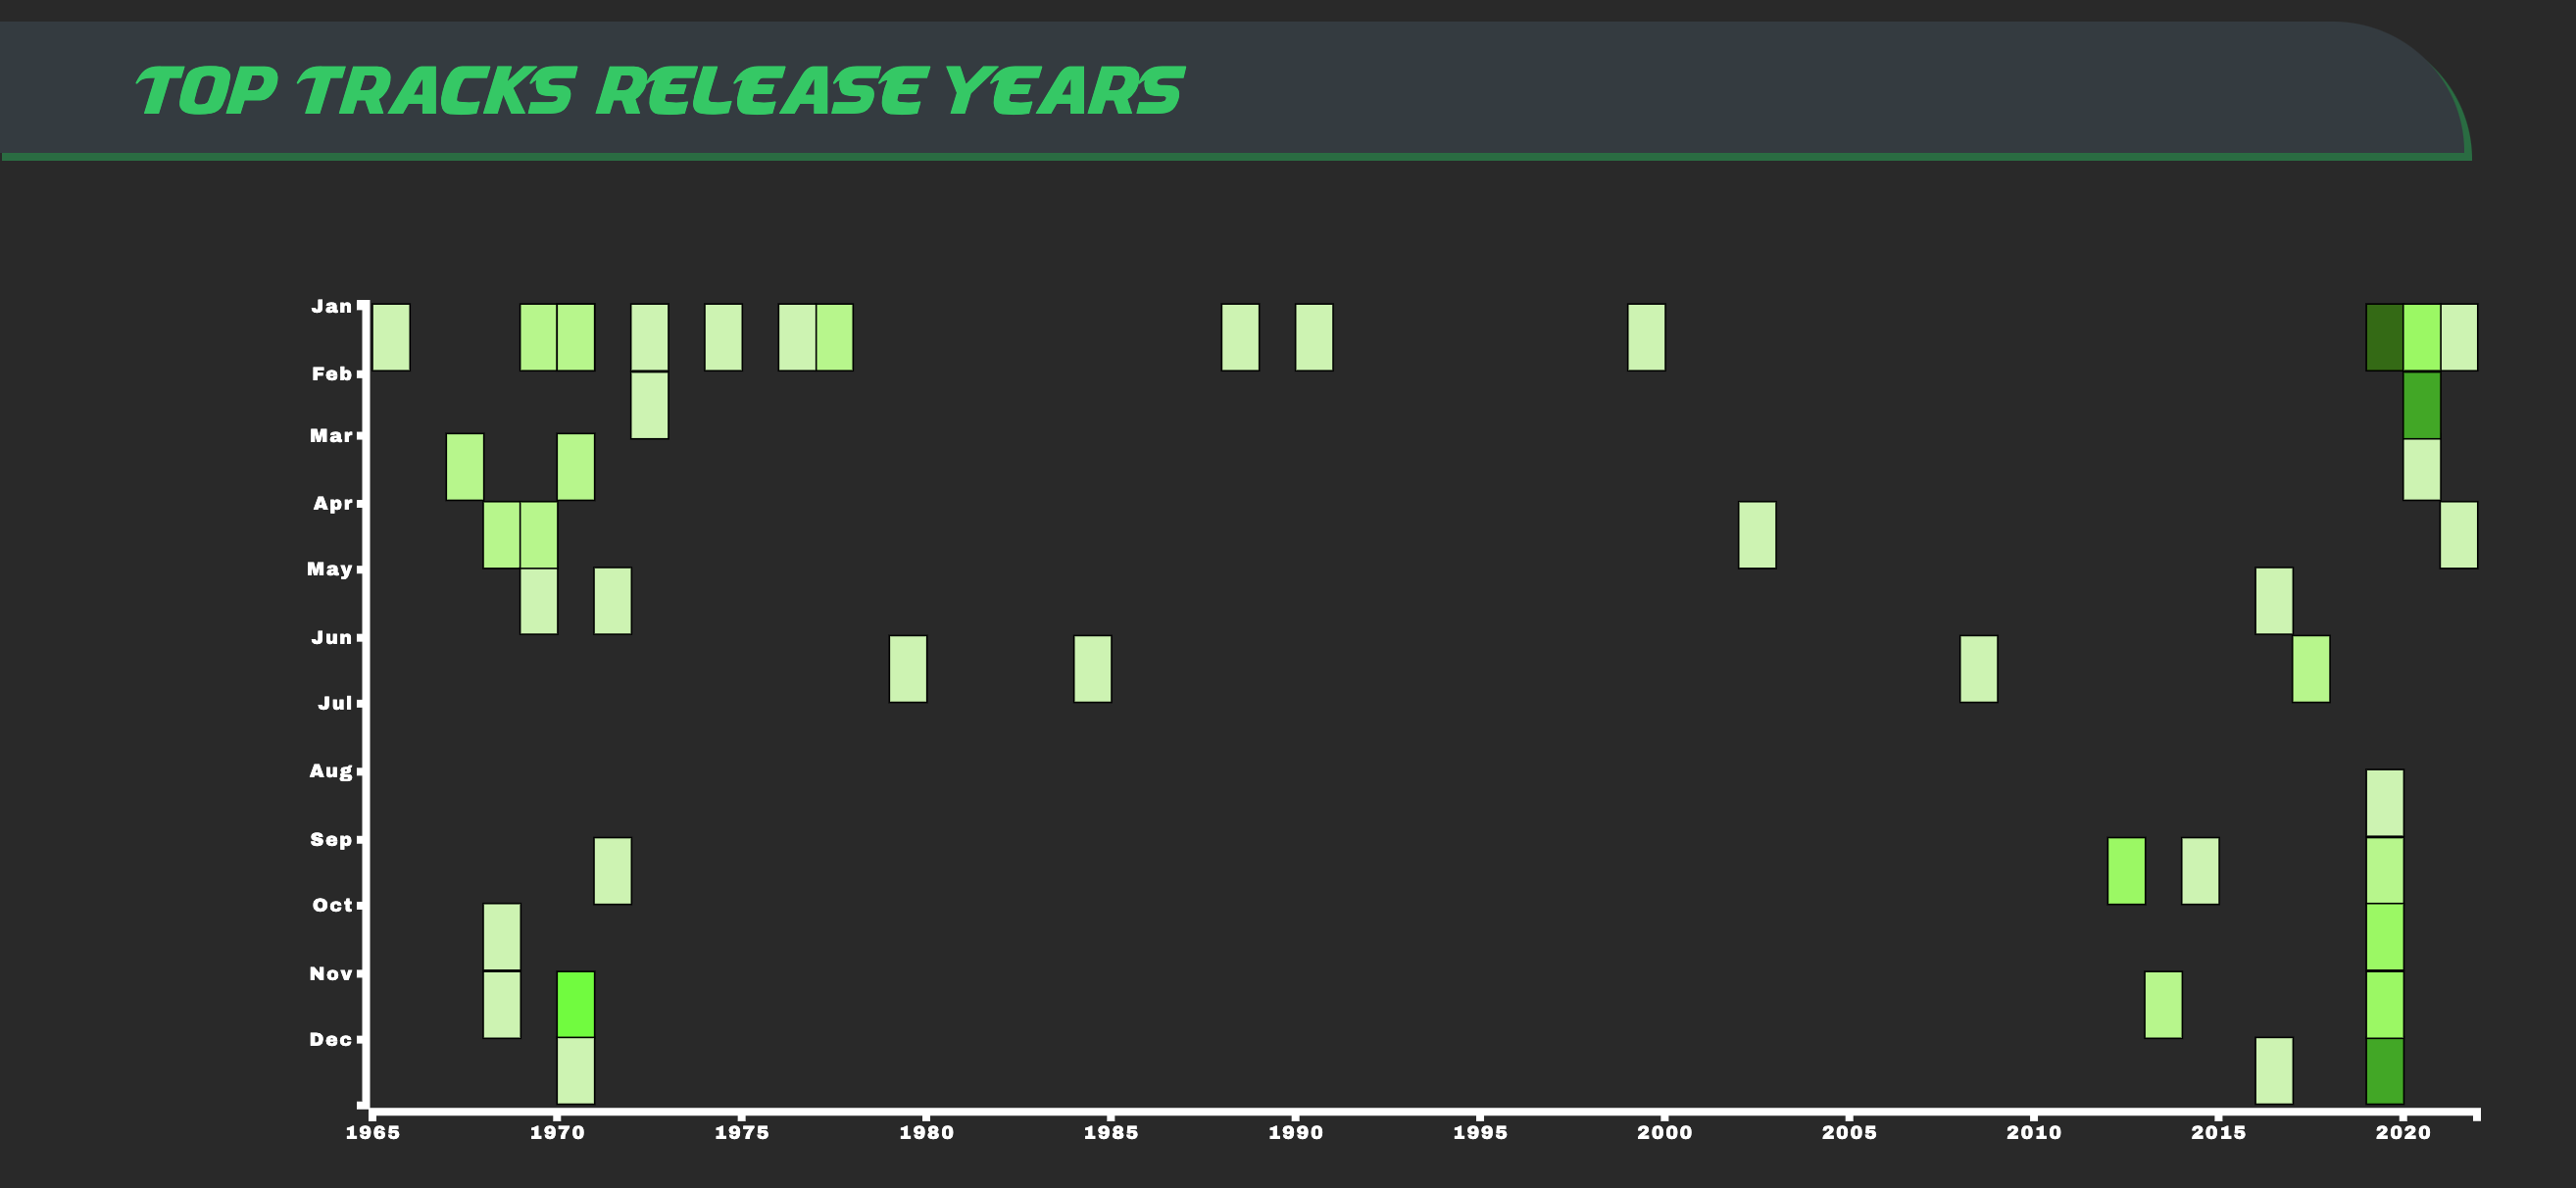
Heatmap showcases user's top 100 tracks and their release dates - learn if you're an old soul or a modern music lover!
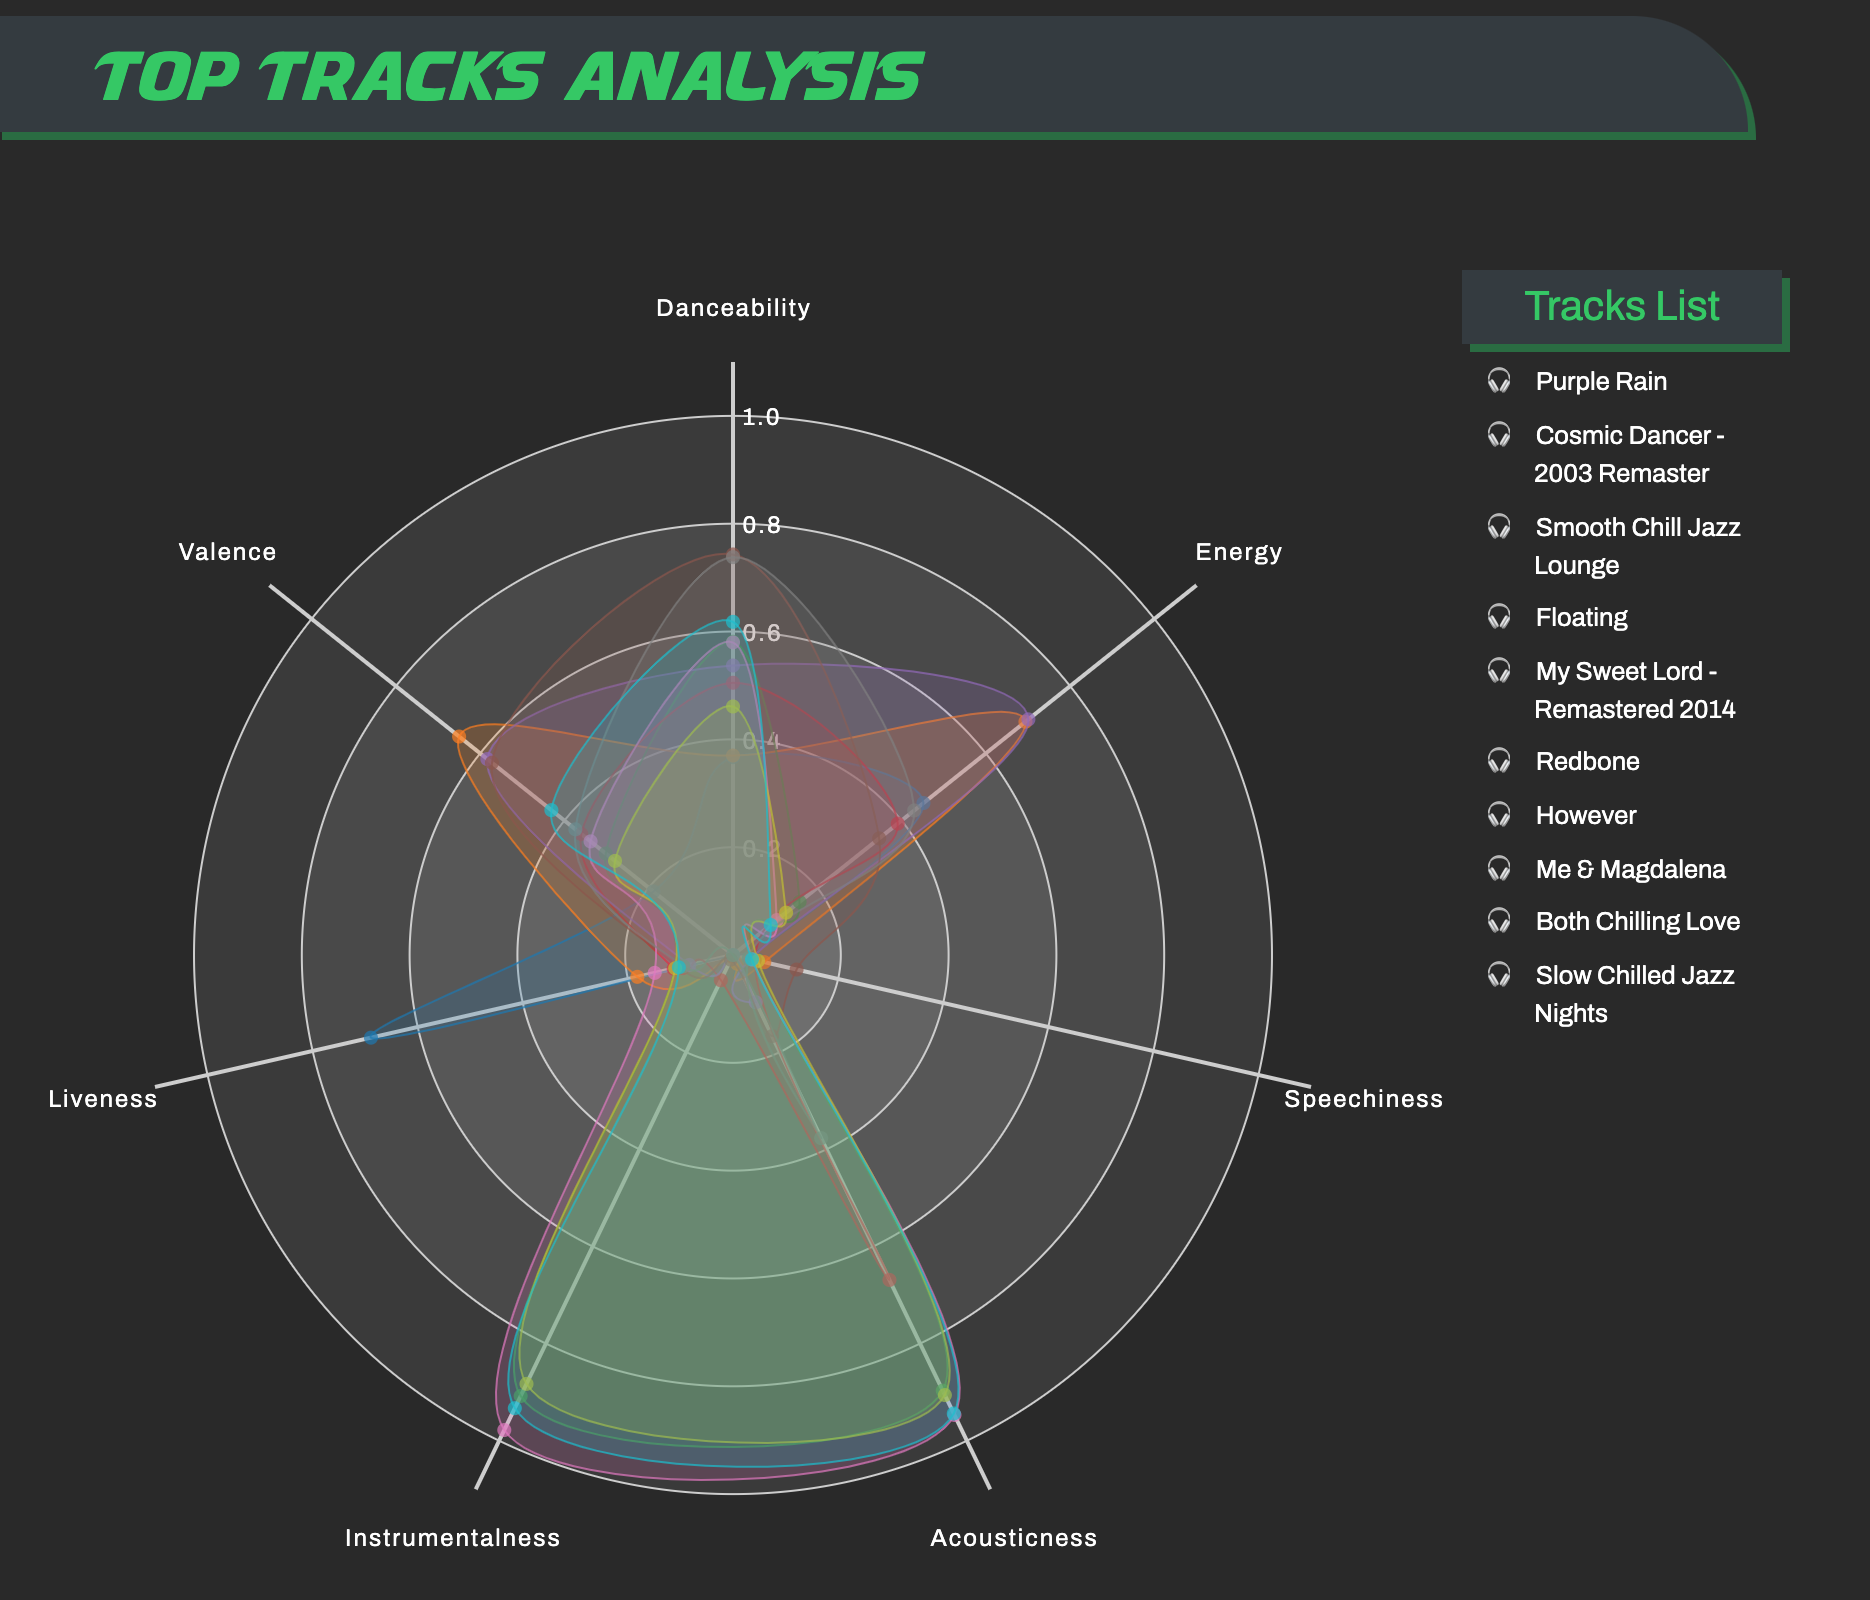
Track analysis showcases the user's top 10 tracks music analysis as created by Spotify.
NodeJS with Express as backend, using GraphQL to fetch data from Spotify's API. Uses ReactJS with D3.js to create an intuitive UI and visualize the data with smooth animations.
Install dependencies with npm install.
- Apollo
- Bootstrap
- Cookie-parser
- Cors
- D3
- D3-Hexbin
- Envdot
- Express
- Morgan
- React
- React-D3-Radar
- React-Dom
- React-Loader-Spinner
- React-Router-Dom
- Sass
Enjoy!