computeMatrix & plotProfile for AT% plot #646
Description
Hi all!
I'm trying to use plotProfile for plotting AT%. For this, I created BED files for upregulated, downregulated & unresponsive genes as region files. For bigwig file, I created bed file for whole genome with interval of 500bp & calculated AT% using 'bedtools nuc' function. This bed file was converted to bigwig file, containing AT% as the values, using couple of tools.
The deeptools commands are here:
computeMatrix reference-point -S /home/whole_genome_sorted_new.bw -R /home/up /home/unresponsive /home/down -a 3000 -b 3000 --referencePoint TSS --outFileName /home/all_matrix_3000_new --averageTypeBins mean --binSize 100
plotProfile -m /home/all_matrix_3000_new -out /home/all_TSS_plot2_new.png --plotTitle "" --yAxisLabel "AT %" --colors red yellow blue --dpi 500 --legendLocation best --plotTitle "" --plotHeight 15 --plotWidth 20
The plot :
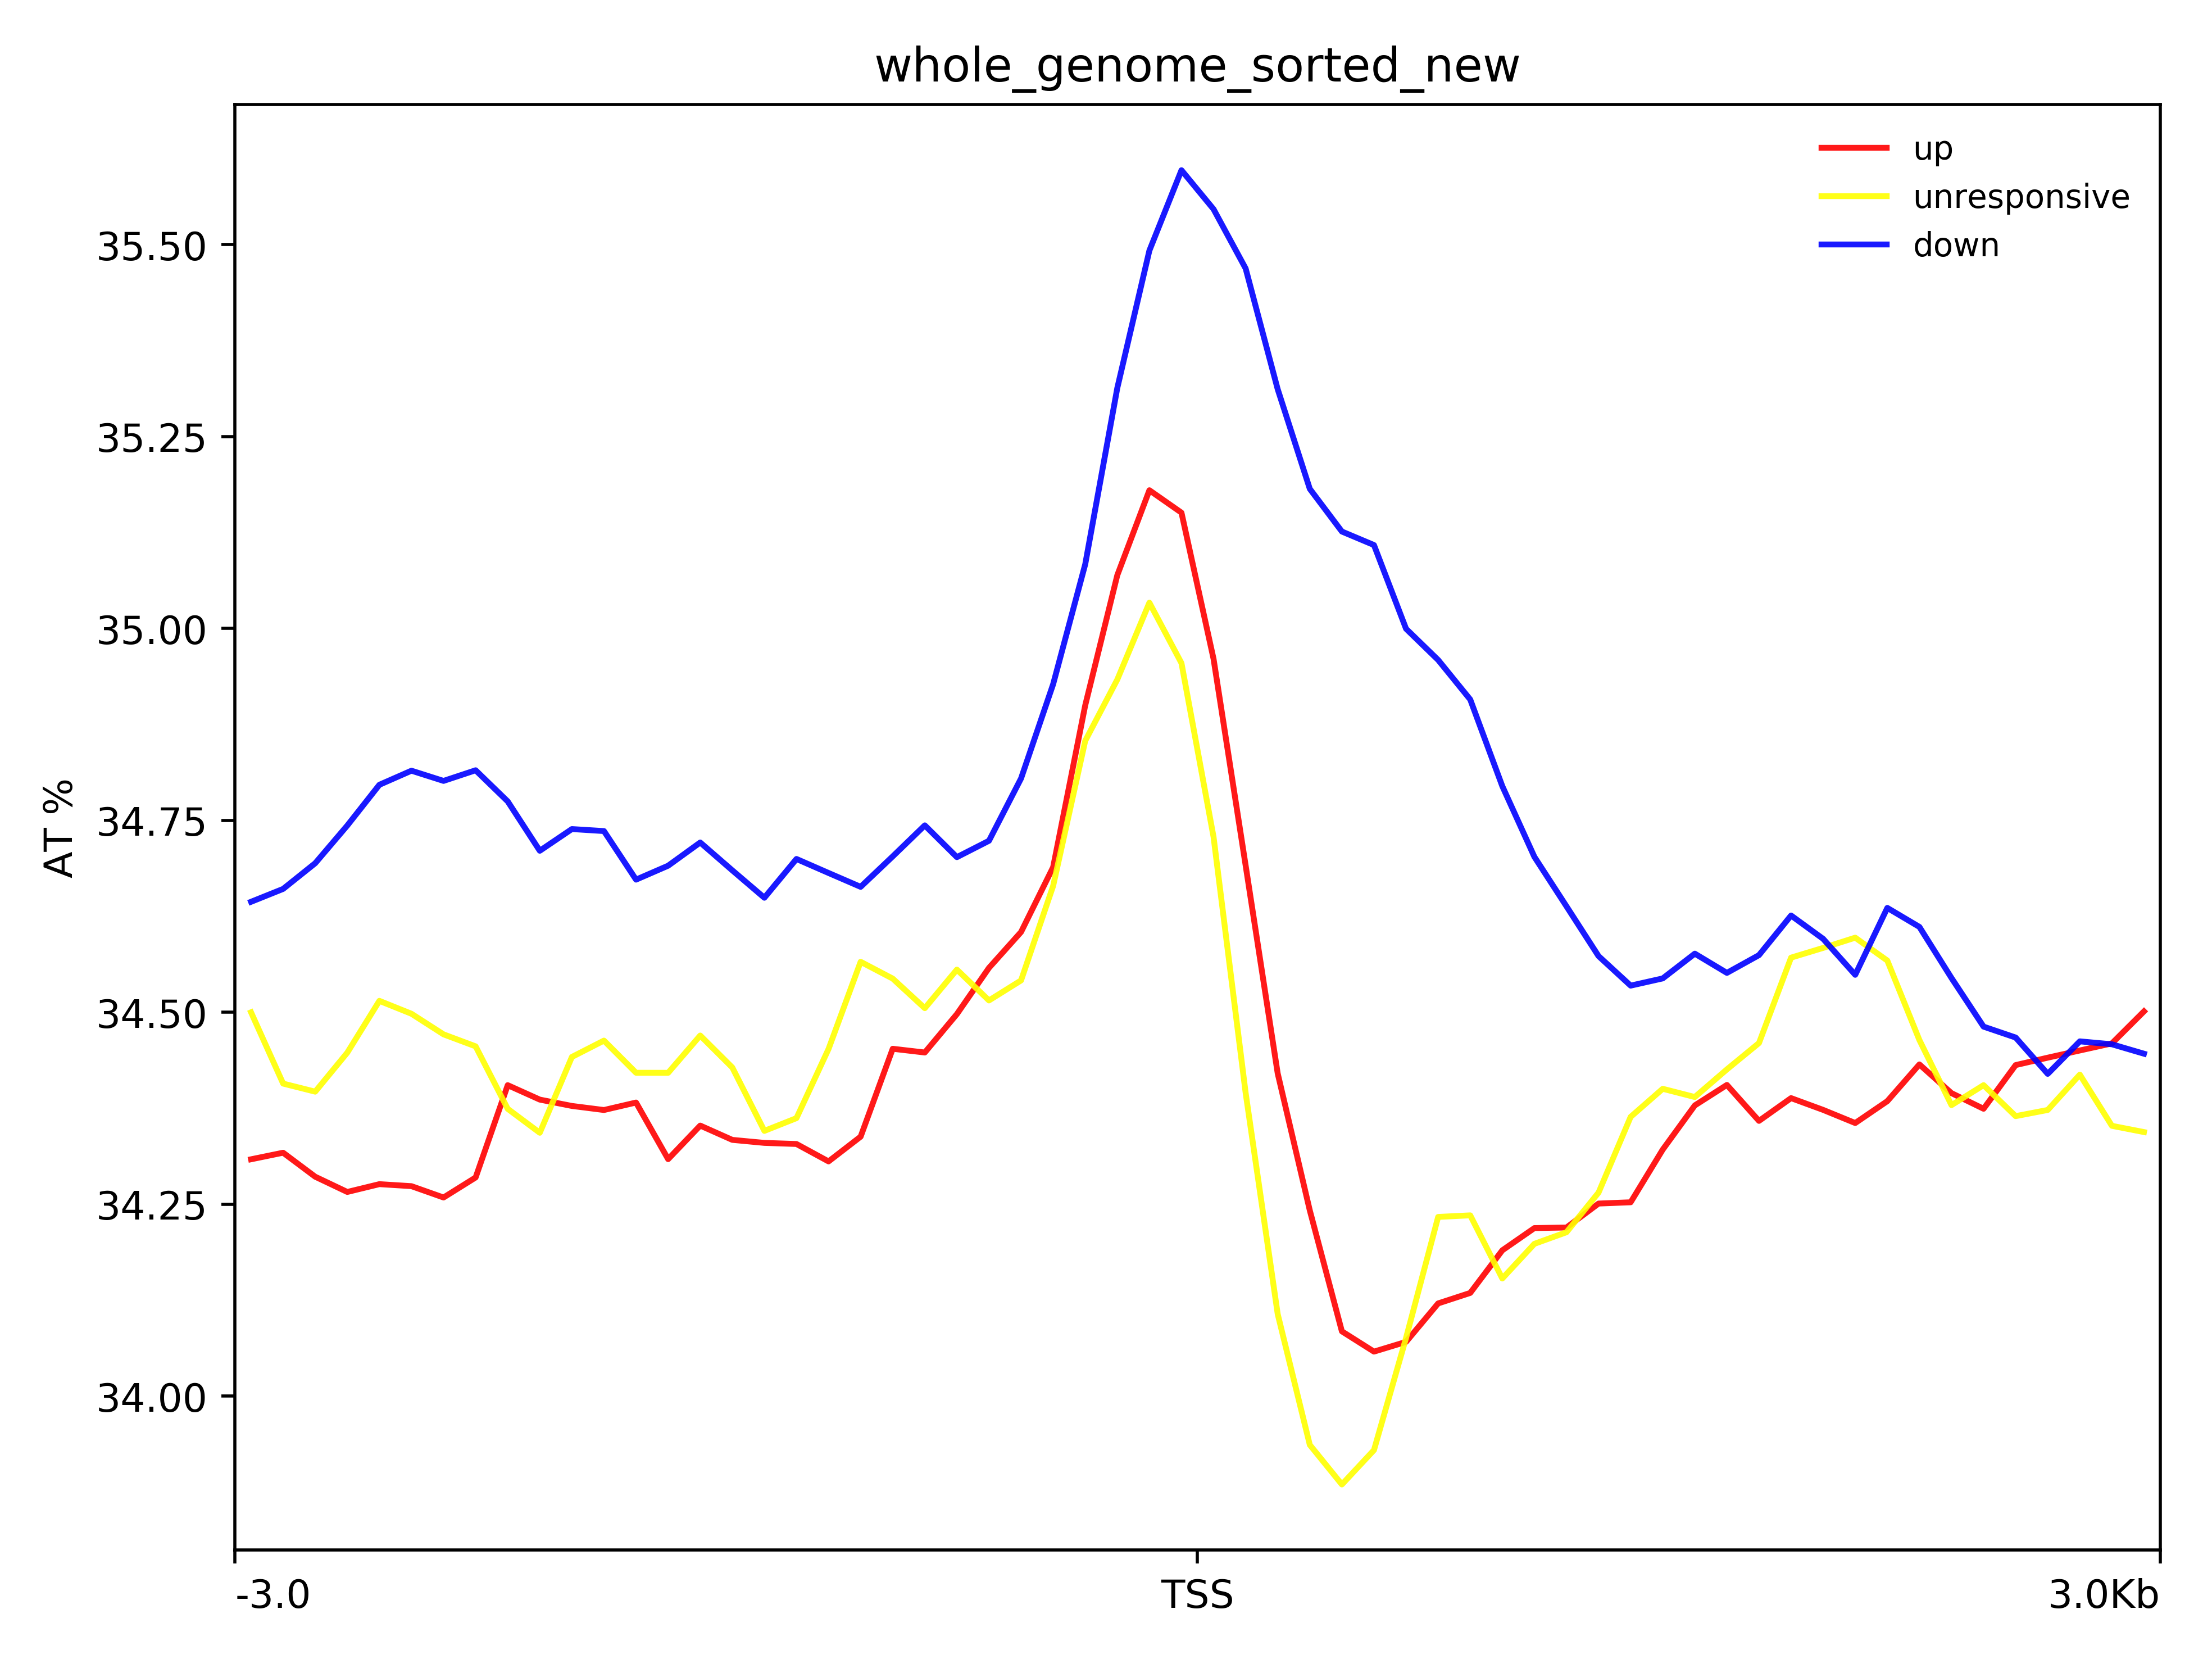
But my bigwig file contains data ranging from 0-46 & it's not represented in the plot what can be the possible reason? Please help.