Do not panic if database is closed #437
Conversation
|
Review status: 0 of 5 files reviewed at latest revision, 1 unresolved discussion. db.go, line 78 at r1 (raw file):
Instead of using a chan as a flag, use atomics. https://golang.org/pkg/sync/atomic/#StoreInt32 Comments from Reviewable |
|
Yes... @adelowo why you choosed a channel instead of atomic uint32 for example, is a theory behind it that we should care about? |
|
I would update it to make use of atomics... @kataras The reasoning was an empty struct should consume no storage |
|
Can you take a look at this now @manishrjain ? edit :: Probably should have used reviewable instead |
|
Review status: 0 of 5 files reviewed at latest revision, 4 unresolved discussions. db.go, line 341 at r2 (raw file):
Use Store instead of add. Also, move this right after checking Line 669 in 8e23f14 errors.go, line 27 at r2 (raw file):
full stop at end. transaction.go, line 551 at r2 (raw file):
Instead of doing this over here and in View, do this within NewTransaction. We'd still have to deal with the case where DB is closed while a pending transaction is still live. That txn would try to read and write, and still cause panics. Comments from Reviewable |
|
Review status: 0 of 5 files reviewed at latest revision, 4 unresolved discussions. transaction.go, line 551 at r2 (raw file): Previously, manishrjain (Manish R Jain) wrote…
Comments from Reviewable |
|
Review status: 0 of 5 files reviewed at latest revision, 4 unresolved discussions. errors.go, line 27 at r2 (raw file): Previously, manishrjain (Manish R Jain) wrote…
Done... updated the comment anyways Comments from Reviewable |
|
Review status: 0 of 5 files reviewed at latest revision, 4 unresolved discussions. transaction.go, line 551 at r2 (raw file): Previously, adelowo (Lanre Adelowo) wrote…
Can you also respond to the second part of that comment? Dealing with the case where there's a pending txn still live. Comments from Reviewable |
|
Review status: 0 of 5 files reviewed at latest revision, 3 unresolved discussions, some commit checks failed. Comments from Reviewable |
|
In general, some sort of before and after read benchmarking would be reassuring. Review status: 0 of 5 files reviewed at latest revision, 3 unresolved discussions, some commit checks failed. Comments from Reviewable |
|
I would get those in place Review status: 0 of 5 files reviewed at latest revision, 3 unresolved discussions, some commit checks failed. Comments from Reviewable |
|
I ran some benchmark tests Here is the benchmark code (
goos: darwin
goarch: amd64
pkg: github.com/dgraph-io/badger
BenchmarkDB_Oops-8   	   10000	    178647 ns/op	    9044 B/op	      59 allocs/op
PASS
ok  	github.com/dgraph-io/badger	10.982s
goos: darwin
goarch: amd64
pkg: github.com/dgraph-io/badger
BenchmarkDB_Oops-8   	   10000	    205644 ns/op	    9042 B/op	      59 allocs/op
PASS
ok  	github.com/dgraph-io/badger	12.341s
I have also used pprof to measure ( (pprof) list Update
Total: 560ms
ROUTINE ======================== github.com/dgraph-io/badger.(*DB).Update in /Users/lanreadelowo/go/src/github.com/dgraph-io/badger/transaction.go
0 70ms (flat, cum) 12.50% of Total
. . 564:
. . 565: if err := fn(txn); err != nil {
. . 566: return err
. . 567: }
. . 568:
. 70ms 569: return txn.Commit(nil)
. . 570:}
. . 571:
. . 572:func (db *DB) isClosed() bool {
. . 573: return atomic.LoadUint32(&db.closed) > 0
. . 574:}
(pprof) list Commit
Total: 560ms
ROUTINE ======================== github.com/dgraph-io/badger.(*Txn).Commit in /Users/lanreadelowo/go/src/github.com/dgraph-io/badger/transaction.go
0 70ms (flat, cum) 12.50% of Total
. . 464: Value: []byte(strconv.FormatUint(commitTs, 10)),
. . 465: meta: bitFinTxn,
. . 466: }
. . 467: entries = append(entries, e)
. . 468:
. 70ms 469: req, err := txn.db.sendToWriteCh(entries)
. . 470: state.writeLock.Unlock()
. . 471: if err != nil {
. . 472: return err
. . 473: }
. . 474:
(pprof)
For reads,
goos: darwin
goarch: amd64
pkg: github.com/dgraph-io/badger
BenchmarkDB_Damn-8   	 2000000	       760 ns/op	     504 B/op	      10 allocs/op
PASS
ok  	github.com/dgraph-io/badger	14.714s
goos: darwin
goarch: amd64
pkg: github.com/dgraph-io/badger
BenchmarkDB_Damn-8   	 2000000	       788 ns/op	     504 B/op	      10 allocs/op
PASS
ok github.com/dgraph-io/badger 14.340s |
|
Can you add the profile for reads as well? Also include topN. For the update, I'm seeing 15% degradation. Any ideas where's that coming from, if not from atomic? |
|
Hi @manishrjain , nothing points to atomic. It would be nice if someone helps verify this. pprof for (pprof) top20 -cum
Showing nodes accounting for 1.21s, 34.28% of 3.53s total
Dropped 78 nodes (cum <= 0.02s)
Showing top 20 nodes out of 112
flat flat% sum% cum cum%
0 0% 0% 2.82s 79.89% testing.(*B).launch
0 0% 0% 2.82s 79.89% testing.(*B).runN
0 0% 0% 2.81s 79.60% github.com/dgraph-io/badger.BenchmarkDB_Damn
0.01s 0.28% 0.28% 2.75s 77.90% github.com/dgraph-io/badger.(*DB).Update
0.03s 0.85% 1.13% 1.85s 52.41% github.com/dgraph-io/badger.BenchmarkDB_Damn.func3
0.02s 0.57% 1.70% 1.70s 48.16% github.com/dgraph-io/badger.(*Txn).Get
0.30s 8.50% 10.20% 1.62s 45.89% runtime.mallocgc
0.06s 1.70% 11.90% 1.09s 30.88% github.com/dgraph-io/badger.(*DB).get
0.02s 0.57% 12.46% 1.05s 29.75% runtime.newobject
0 0% 12.46% 1.02s 28.90% runtime.systemstack
0 0% 12.46% 0.74s 20.96% runtime.gcStart
0 0% 12.46% 0.73s 20.68% runtime.gcStart.func2
0.73s 20.68% 33.14% 0.73s 20.68% runtime.kevent
0 0% 33.14% 0.73s 20.68% runtime.netpoll
0 0% 33.14% 0.73s 20.68% runtime.startTheWorldWithSema
0 0% 33.14% 0.62s 17.56% runtime.schedule
0 0% 33.14% 0.57s 16.15% runtime.mcall
0 0% 33.14% 0.57s 16.15% runtime.park_m
0 0% 33.14% 0.56s 15.86% github.com/dgraph-io/badger.(*DB).NewTransaction (inline)
0.04s 1.13% 34.28% 0.54s 15.30% github.com/dgraph-io/badger/skl.(*Skiplist).Get
(pprof) top20
Showing nodes accounting for 2.74s, 77.62% of 3.53s total
Dropped 78 nodes (cum <= 0.02s)
Showing top 20 nodes out of 112
flat flat% sum% cum cum%
0.73s 20.68% 20.68% 0.73s 20.68% runtime.kevent
0.43s 12.18% 32.86% 0.43s 12.18% runtime.mach_semaphore_wait
0.30s 8.50% 41.36% 1.62s 45.89% runtime.mallocgc
0.18s 5.10% 46.46% 0.20s 5.67% runtime.heapBitsSetType
0.15s 4.25% 50.71% 0.15s 4.25% runtime.memclrNoHeapPointers
0.14s 3.97% 54.67% 0.14s 3.97% runtime.mach_semaphore_signal
0.12s 3.40% 58.07% 0.21s 5.95% runtime.deferreturn
0.08s 2.27% 60.34% 0.38s 10.76% github.com/dgraph-io/badger/y.ParseKey
0.08s 2.27% 62.61% 0.08s 2.27% runtime.nextFreeFast (inline)
0.06s 1.70% 64.31% 1.09s 30.88% github.com/dgraph-io/badger.(*DB).get
0.06s 1.70% 66.01% 0.36s 10.20% github.com/dgraph-io/badger.(*DB).getMemTables
0.06s 1.70% 67.71% 0.06s 1.70% runtime.acquirem (inline)
0.06s 1.70% 69.41% 0.12s 3.40% runtime.deferproc
0.05s 1.42% 70.82% 0.07s 1.98% runtime.freedefer
0.05s 1.42% 72.24% 0.05s 1.42% syscall.Syscall
0.04s 1.13% 73.37% 0.19s 5.38% github.com/dgraph-io/badger.(*Txn).Commit
0.04s 1.13% 74.50% 0.54s 15.30% github.com/dgraph-io/badger/skl.(*Skiplist).Get
0.04s 1.13% 75.64% 0.05s 1.42% runtime.newdefer
0.04s 1.13% 76.77% 0.05s 1.42% runtime.scanobject
0.03s 0.85% 77.62% 0.07s 1.98% github.com/dgraph-io/badger.(*oracle).decrRef
(pprof) top50
Showing nodes accounting for 3.35s, 94.90% of 3.53s total
Dropped 78 nodes (cum <= 0.02s)
Showing top 50 nodes out of 112
flat flat% sum% cum cum%
0.73s 20.68% 20.68% 0.73s 20.68% runtime.kevent
0.43s 12.18% 32.86% 0.43s 12.18% runtime.mach_semaphore_wait
0.30s 8.50% 41.36% 1.62s 45.89% runtime.mallocgc
0.18s 5.10% 46.46% 0.20s 5.67% runtime.heapBitsSetType
0.15s 4.25% 50.71% 0.15s 4.25% runtime.memclrNoHeapPointers
0.14s 3.97% 54.67% 0.14s 3.97% runtime.mach_semaphore_signal
0.12s 3.40% 58.07% 0.21s 5.95% runtime.deferreturn
0.08s 2.27% 60.34% 0.38s 10.76% github.com/dgraph-io/badger/y.ParseKey
0.08s 2.27% 62.61% 0.08s 2.27% runtime.nextFreeFast (inline)
0.06s 1.70% 64.31% 1.09s 30.88% github.com/dgraph-io/badger.(*DB).get
0.06s 1.70% 66.01% 0.36s 10.20% github.com/dgraph-io/badger.(*DB).getMemTables
0.06s 1.70% 67.71% 0.06s 1.70% runtime.acquirem (inline)
0.06s 1.70% 69.41% 0.12s 3.40% runtime.deferproc
0.05s 1.42% 70.82% 0.07s 1.98% runtime.freedefer
0.05s 1.42% 72.24% 0.05s 1.42% syscall.Syscall
0.04s 1.13% 73.37% 0.19s 5.38% github.com/dgraph-io/badger.(*Txn).Commit
0.04s 1.13% 74.50% 0.54s 15.30% github.com/dgraph-io/badger/skl.(*Skiplist).Get
0.04s 1.13% 75.64% 0.05s 1.42% runtime.newdefer
0.04s 1.13% 76.77% 0.05s 1.42% runtime.scanobject
0.03s 0.85% 77.62% 0.07s 1.98% github.com/dgraph-io/badger.(*oracle).decrRef
0.03s 0.85% 78.47% 1.85s 52.41% github.com/dgraph-io/badger.BenchmarkDB_Damn.func3
0.03s 0.85% 79.32% 0.03s 0.85% github.com/dgraph-io/badger/skl.(*Skiplist).DecrRef (inline)
0.03s 0.85% 80.17% 0.03s 0.85% github.com/dgraph-io/badger/y.(*ValueStruct).Decode
0.03s 0.85% 81.02% 0.05s 1.42% github.com/dgraph-io/badger/y.CompareKeys
0.03s 0.85% 81.87% 0.30s 8.50% runtime.convT2Eslice
0.03s 0.85% 82.72% 0.03s 0.85% runtime.jmpdefer
0.03s 0.85% 83.57% 0.03s 0.85% runtime.mach_semaphore_timedwait
0.03s 0.85% 84.42% 0.03s 0.85% runtime.usleep
0.03s 0.85% 85.27% 0.04s 1.13% runtime.wbBufFlush1
0.02s 0.57% 85.84% 1.70s 48.16% github.com/dgraph-io/badger.(*Txn).Get
0.02s 0.57% 86.40% 0.02s 0.57% github.com/dgraph-io/badger/y.ParseTs (inline)
0.02s 0.57% 86.97% 0.40s 11.33% github.com/dgraph-io/badger/y.SameKey
0.02s 0.57% 87.54% 0.03s 0.85% github.com/dgryski/go-farm.Fingerprint64
0.02s 0.57% 88.10% 0.02s 0.57% runtime.cmpbody
0.02s 0.57% 88.67% 0.08s 2.27% runtime.growslice
0.02s 0.57% 89.24% 0.02s 0.57% runtime.heapBitsForAddr (inline)
0.02s 0.57% 89.80% 0.02s 0.57% runtime.heapBitsForObject
0.02s 0.57% 90.37% 1.05s 29.75% runtime.newobject
0.02s 0.57% 90.93% 0.11s 3.12% runtime.rawbyteslice
0.02s 0.57% 91.50% 0.02s 0.57% runtime.releasem (inline)
0.02s 0.57% 92.07% 0.02s 0.57% sync.(*Mutex).Lock
0.02s 0.57% 92.63% 0.02s 0.57% sync.(*Mutex).Unlock
0.02s 0.57% 93.20% 0.02s 0.57% sync.(*RWMutex).RLock
0.01s 0.28% 93.48% 2.75s 77.90% github.com/dgraph-io/badger.(*DB).Update
0.01s 0.28% 93.77% 0.08s 2.27% github.com/dgraph-io/badger.(*Txn).Discard
0.01s 0.28% 94.05% 0.10s 2.83% github.com/dgraph-io/badger/y.KeyWithTs
0.01s 0.28% 94.33% 0.05s 1.42% runtime.gcDrain
0.01s 0.28% 94.62% 0.02s 0.57% runtime.lock
0.01s 0.28% 94.90% 0.20s 5.67% runtime.makemap_small
0 0% 94.90% 0.02s 0.57% github.com/dgraph-io/badger.(*DB).Close
(pprof) list Get
Total: 3.53s
ROUTINE ======================== github.com/dgraph-io/badger.(*Txn).Get in /Users/lanreadelowo/go/src/github.com/dgraph-io/badger/transaction.go
      20ms      1.70s (flat, cum) 48.16% of Total
         .          .    331:           return nil, ErrEmptyKey
         .          .    332:   } else if txn.discarded {
         .          .    333:           return nil, ErrDiscardedTxn
         .          .    334:   }
         .          .    335:
      10ms      380ms    336:   item = new(Item)
         .          .    337:   if txn.update {
. 10ms 338: if e, has := txn.pendingWrites[string(key)]; has && bytes.Equal(key, e.Key) {
. . 339: if isDeletedOrExpired(e.meta, e.ExpiresAt) {
. . 340: return nil, ErrKeyNotFound
. . 341: }
. . 342: // Fulfill from cache.
. . 343: item.meta = e.meta
. . 344: item.val = e.Value
. . 345: item.userMeta = e.UserMeta
. . 346: item.key = key
. . 347: item.status = prefetched
. . 348: item.version = txn.readTs
. . 349: // We probably don't need to set db on item here.
. . 350: return item, nil
. . 351: }
. . 352: // Only track reads if this is update txn. No need to track read if txn serviced it
. . 353: // internally.
. 30ms 354: fp := farm.Fingerprint64(key)
10ms 90ms 355: txn.reads = append(txn.reads, fp)
. . 356: }
. . 357:
. 100ms 358: seek := y.KeyWithTs(key, txn.readTs)
. 1.09s 359: vs, err := txn.db.get(seek)
. . 360: if err != nil {
. . 361: return nil, errors.Wrapf(err, "DB::Get key: %q", key)
. . 362: }
. . 363: if vs.Value == nil && vs.Meta == 0 {
. . 364: return nil, ErrKeyNotFound
ROUTINE ======================== github.com/dgraph-io/badger/skl.(*Skiplist).Get in /Users/lanreadelowo/go/src/github.com/dgraph-io/badger/skl/skl.go
40ms 540ms (flat, cum) 15.30% of Total
. . 379:}
. . 380:
. . 381:// Get gets the value associated with the key. It returns a valid value if it finds equal or earlier
. . 382:// version of the same key.
. . 383:func (s *Skiplist) Get(key []byte) y.ValueStruct {
10ms 70ms 384: n, _ := s.findNear(key, false, true) // findGreaterOrEqual.
. . 385: if n == nil {
. . 386: return y.ValueStruct{}
. . 387: }
. . 388:
. . 389: nextKey := s.arena.getKey(n.keyOffset, n.keySize)
20ms 420ms 390: if !y.SameKey(key, nextKey) {
. . 391: return y.ValueStruct{}
. . 392: }
. . 393:
. . 394: valOffset, valSize := n.getValueOffset()
10ms 40ms 395: vs := s.arena.getVal(valOffset, valSize)
. 10ms 396: vs.Version = y.ParseTs(nextKey)
. . 397: return vs
. . 398:}
. . 399:
. . 400:// NewIterator returns a skiplist iterator. You have to Close() the iterator.
. . 401:func (s *Skiplist) NewIterator() *Iterator {
(pprof)
|
|
Thanks for this. But, the code which is calling the new |
|
That is all that is being shown... Not too familiar with pprof, can you help verify that ? Anyways, I generated an image of the entire profile |
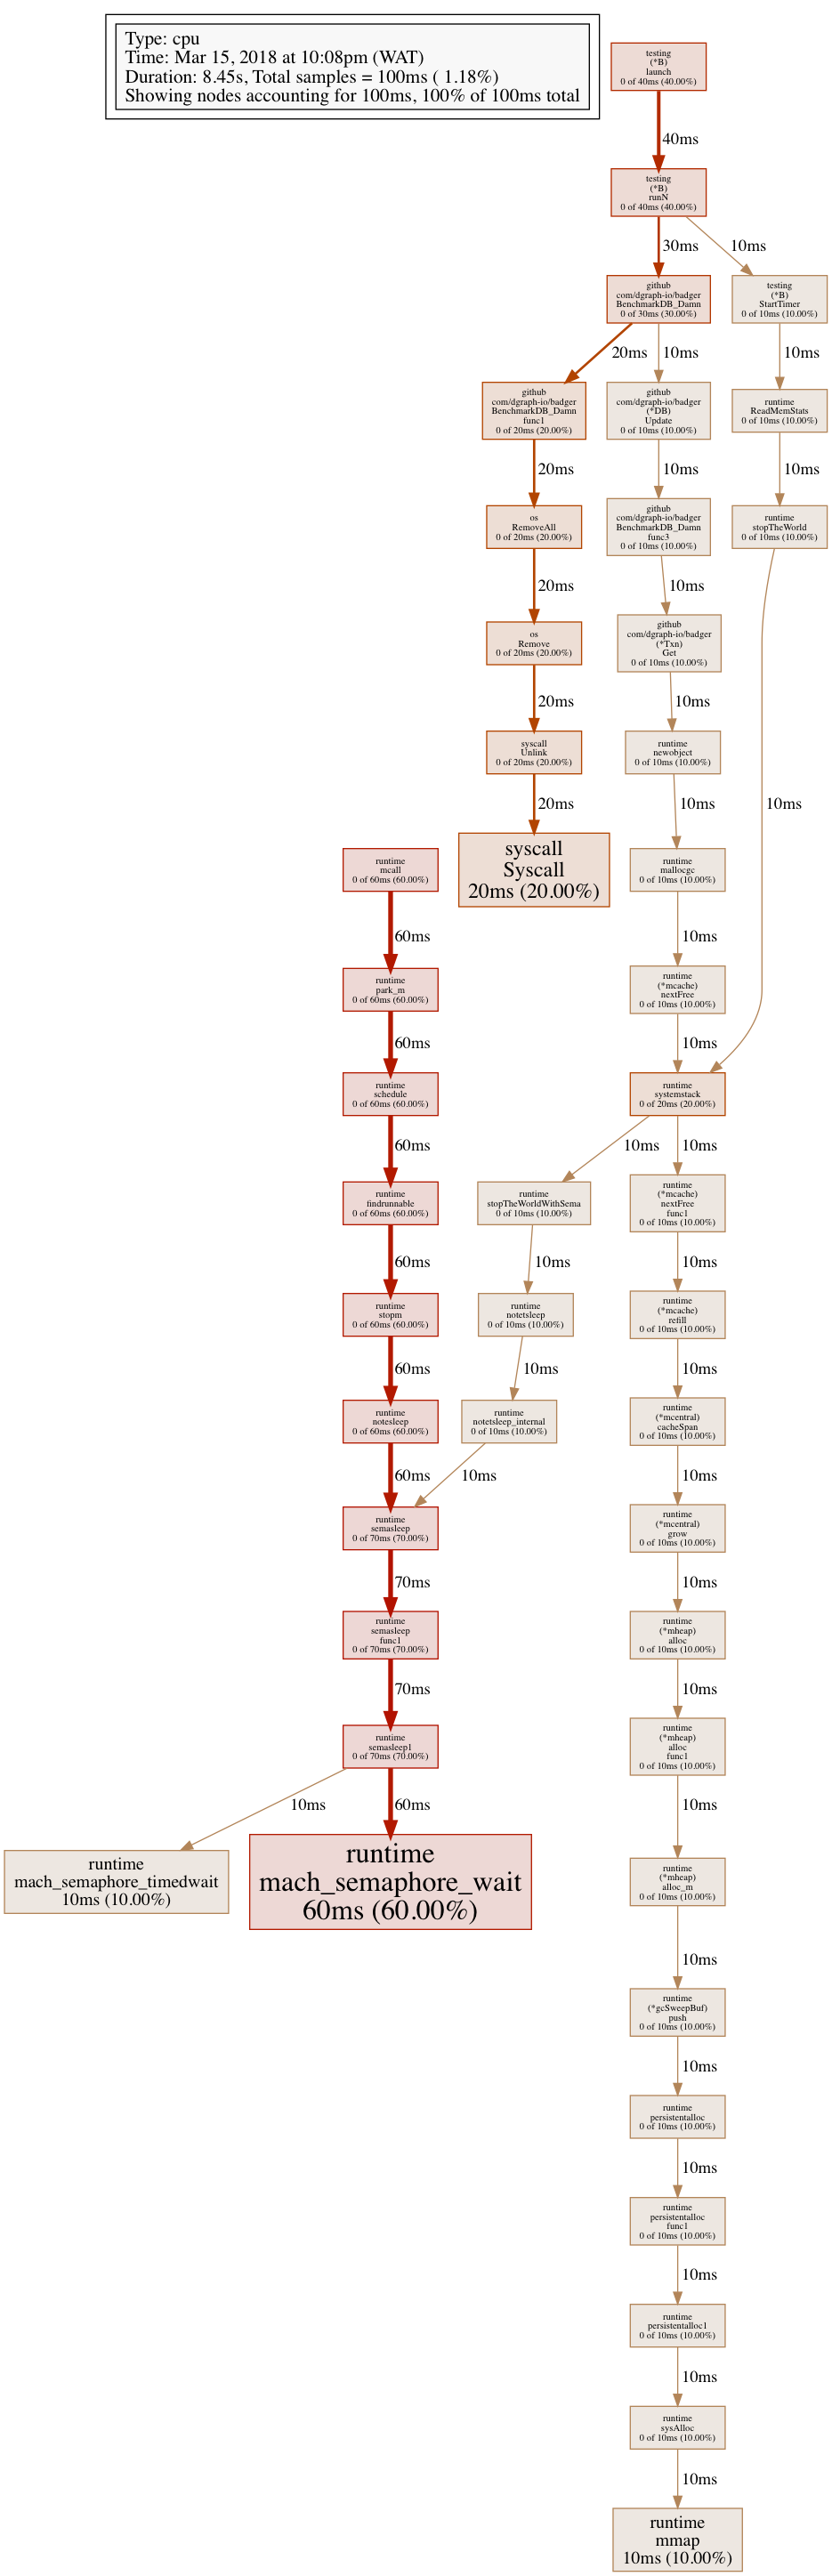
|
Hey guys, anything the ipfs team can do to help move this one along? |
|
I want to get a sense of how much slowness this change brings to concurrent reads. Maybe if your team (@whyrusleeping) can help benchmark that, that'd be good. The potential performance hit of this approach is the main concern here. The profile image doesn't have any relevant code from Badger. It seems like it wasn't done correctly. |
|
@schomatis you game for some benchmarking? |
|
Sure. |
|
@manishrjain Before going through with the benchmark tests let me make some remarks that I would appreciate your feedback on:
|
|
Hey @schomatis ,
|
I was referring (and maybe you weren't and I misunderstood the review comment) to the case were an operation like
I've meant this is not thread-safe. Maybe it's not meant to be, but if it is, the atomic operations do not guarantee that. Two different goroutines can call In case thread-safety wasn't the goal the atomic operations can be discarded, they have a performance penalty without achieving its goal. From my perspective, the central issue is that clearly certain operations cannot run in parallel in the DB (e.g., That's what (in my opinion) is worth evaluating. As you correctly worry, going down this road will have (not negligible) performance implications. Some users would appreciate it, as they won't have to check for that since it will be handled by Badger (avoiding some unpleasant panics), other users won't, as the performance degradation may be undesirable (and maybe they already have an underlying synchronization mechanism in the code that consumes the API and Badger's own synchronization mechanism would seem redundant). I think this PR goes in the right direction but falls short in defining what is Badger willing to do and what is left to the user (and that should be documented in the API.) |
|
I agree with your assessment -- if we try to solve this problem with more code, we'd need to consider all the various edge cases that could happen to do it right. All of these would then add more complexity and come with some performance impact. I think this issue is purely in the domain of having clear documentation instead. We clearly tell users to not access the DB after closing it and point out in FAQ the exact error they might receive if that happens. That'd be the right division between what Badger can do and what the user should do at their end. If there are no objections, my take is to close this PR and fix documentation instead. |
|
One thing that might help, and have minimal impact of performance, would be to have an atomic reference counter for operations that may panic if the db is closed. Then we could at least check if things may panic before calling close (and use that to wait for cleanup/finishup on the user side) |
|
Then again, that will probably have the same perf impact as this PR |
|
@manishrjain I agree that this PR could be closed and in its place another issue could be opened to fully discuss how to handle this. Merging this PR as is will solve some of the problems mentioned here and its cost will probably be a very low performance impact but it has the danger of giving the impression that Badger's API is thread-safe and that might confuse the design of use cases for the consumers of the API. |
|
Agreed. Thanks for the detailed write-up and thorough analysis of the issue, @schomatis. Thanks, @adelowo for the PR and for following through with all the reviews requested. Unfortunately, can't accept this PR, but there are many other issues in Badger which I could use your help with. Thanks again! |
|
Thanks for your input(s) @schomatis . I agree with your statement on thread safety.. |
Fixes #420 and #374
This change is