Repository navigation
Interface
Screenshots of the web UI as it runs today (Rails 8.1.4.1, 2026). They were taken against a seeded demonstration dataset, so the hosts, users, and event text are fabricated — the layout, controls, and column sets are real.

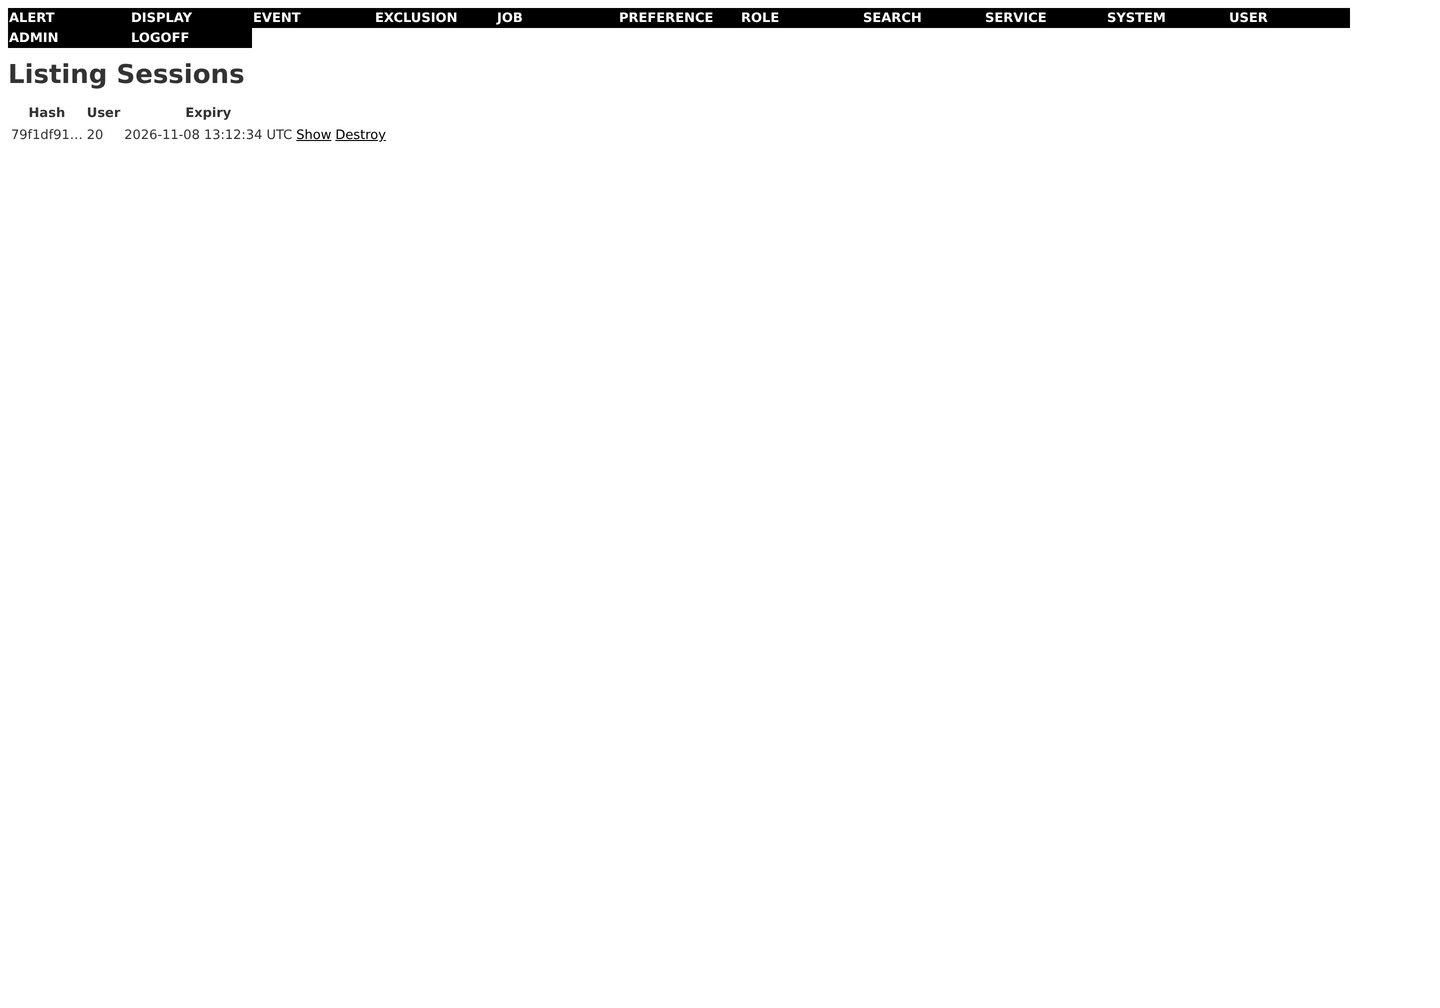
/users/logon posts to /users/do_logon. A successful logon mints a Session
row and sets a plain sessionID cookie — sessions are database rows looked up by
token, not signed cookies. See Access Control for the consequences, the
5-attempt lockout, and how rights are granted.
/ is the live feed plus the throughput charts. The feed is refreshed by
/events/recent, which Event.recent_events self-tunes and which must not
write — a page being looked at used to issue an UPDATE per poll per viewer.
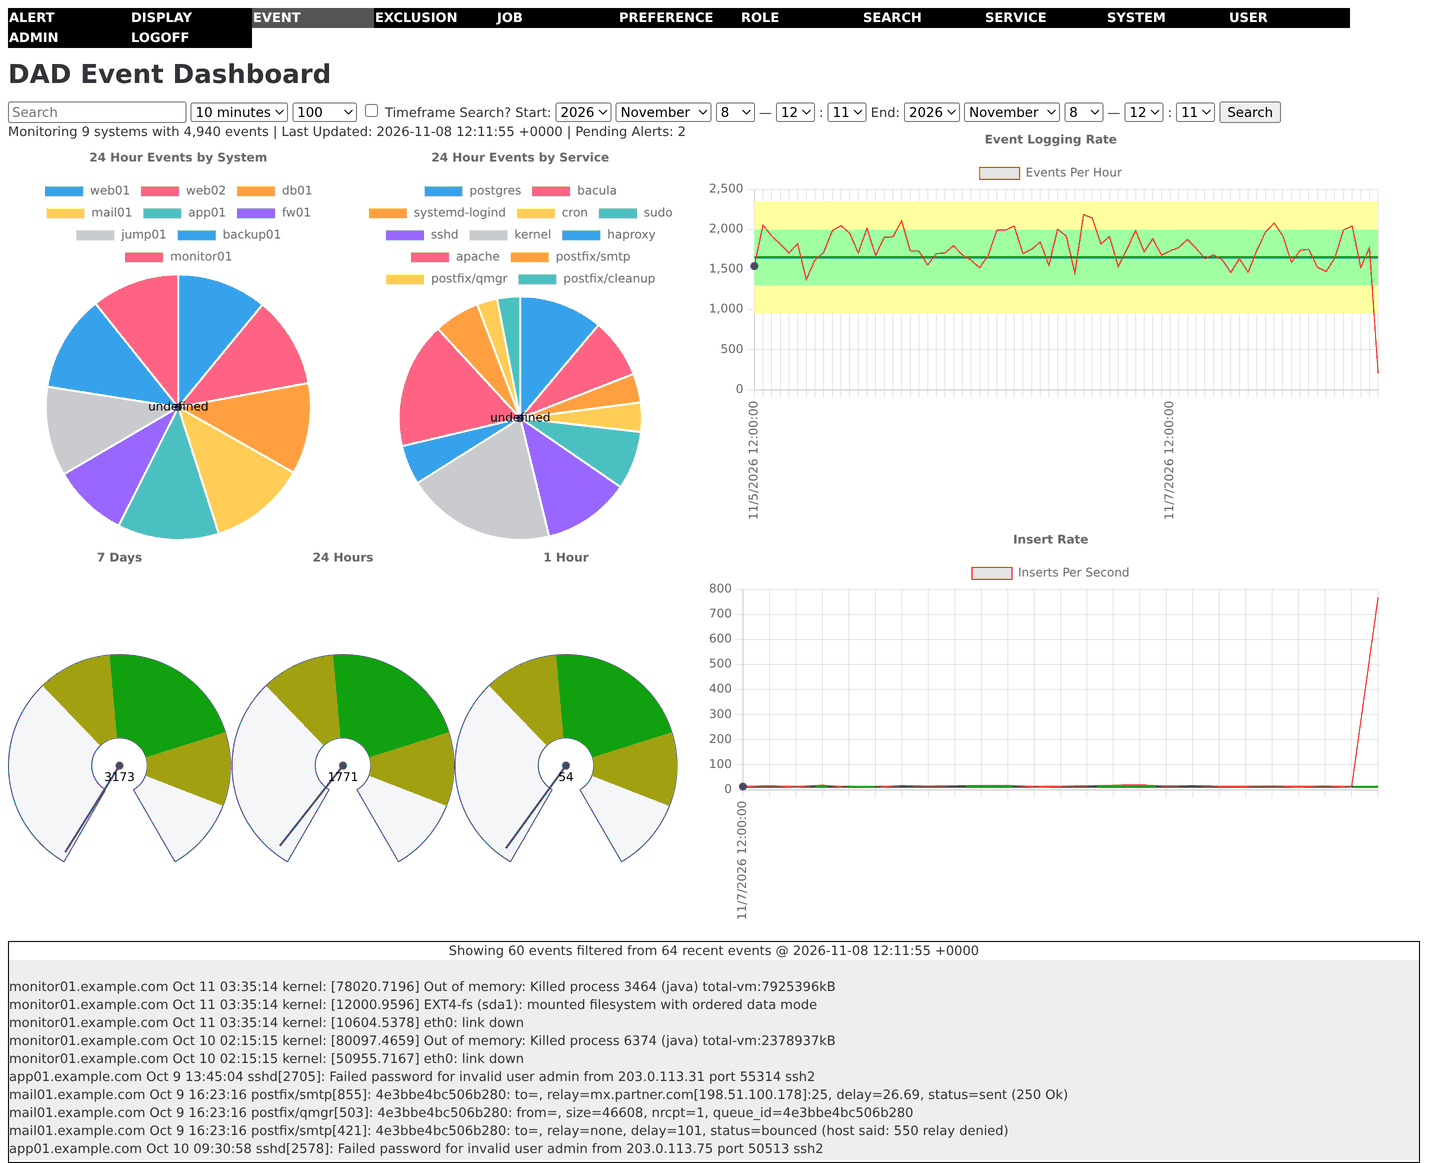
Seven charts render, drawn by app/views/events/index.js.erb and refreshed every
60 seconds:
| chart | kind | shows |
|---|---|---|
7_days_chart, 1_day_chart, 1_hour_chart
|
gauge | total events over that window, against a mean and standard-deviation band derived from the hourly series |
systems_chart, services_chart
|
pie | events in the last 24 hours grouped by system and by service |
logging_rate |
longitudinal | events per hour over 7 days |
insert_rate |
longitudinal | inserts per second over 24 hours |
draw_graph — which is what renders systems_chart and services_chart — draws a
pie, not a bar. The name predates the Chart.js rewrite and is kept because the
.js.erb templates call these five draw_* helpers positionally; see
Development.
There is no disk utilization chart. An eighth draw_diskspace_graph call sits
commented out in that same file — bec738c ("Hiding disk gauge", 2015-02-28),
with the note "Removed for now. There is a configured alert for this." Disk usage
is reported by the disk_utilization job and controlled by the archive floor under
Preferences; see Retention and Archives. The job's reading goes to the
scheduler log — journalctl -u dad-scheduler — not to the Jobs screens.
The refresh is a client-side poll: app/assets/javascripts/events.js fires the
first GET /events.js, and the bottom of app/views/events/index.js.erb schedules
the next one 60 seconds later. So the charts, the feed and the "Monitoring N
systems…" line are all written by that script — with JavaScript disabled, the
dashboard is its empty shell of divs.
The poll used to carry complete: $.ajax(), which calls $.ajax() with no
options while the options object is being built. jQuery then used
ajaxSettings.url — the current page — so every poll fired a second request that
re-rendered /events as HTML, and the complete: handler never ran at all, because
jQuery drops any callback that is not a function. That is fixed; see
What Changed Since 2016.
The layout declares width=device-width, and below 720px the nav bar lets its tabs
wrap and the alert queue stops being a fixed-width table. Before this the nav bar
was 19 tabs at 120px each — 2280px — inside overflow: hidden, so on a phone most
admin tabs were clipped and unreachable. There is deliberately no hamburger menu:
that would need JavaScript the app does not have. See Development.
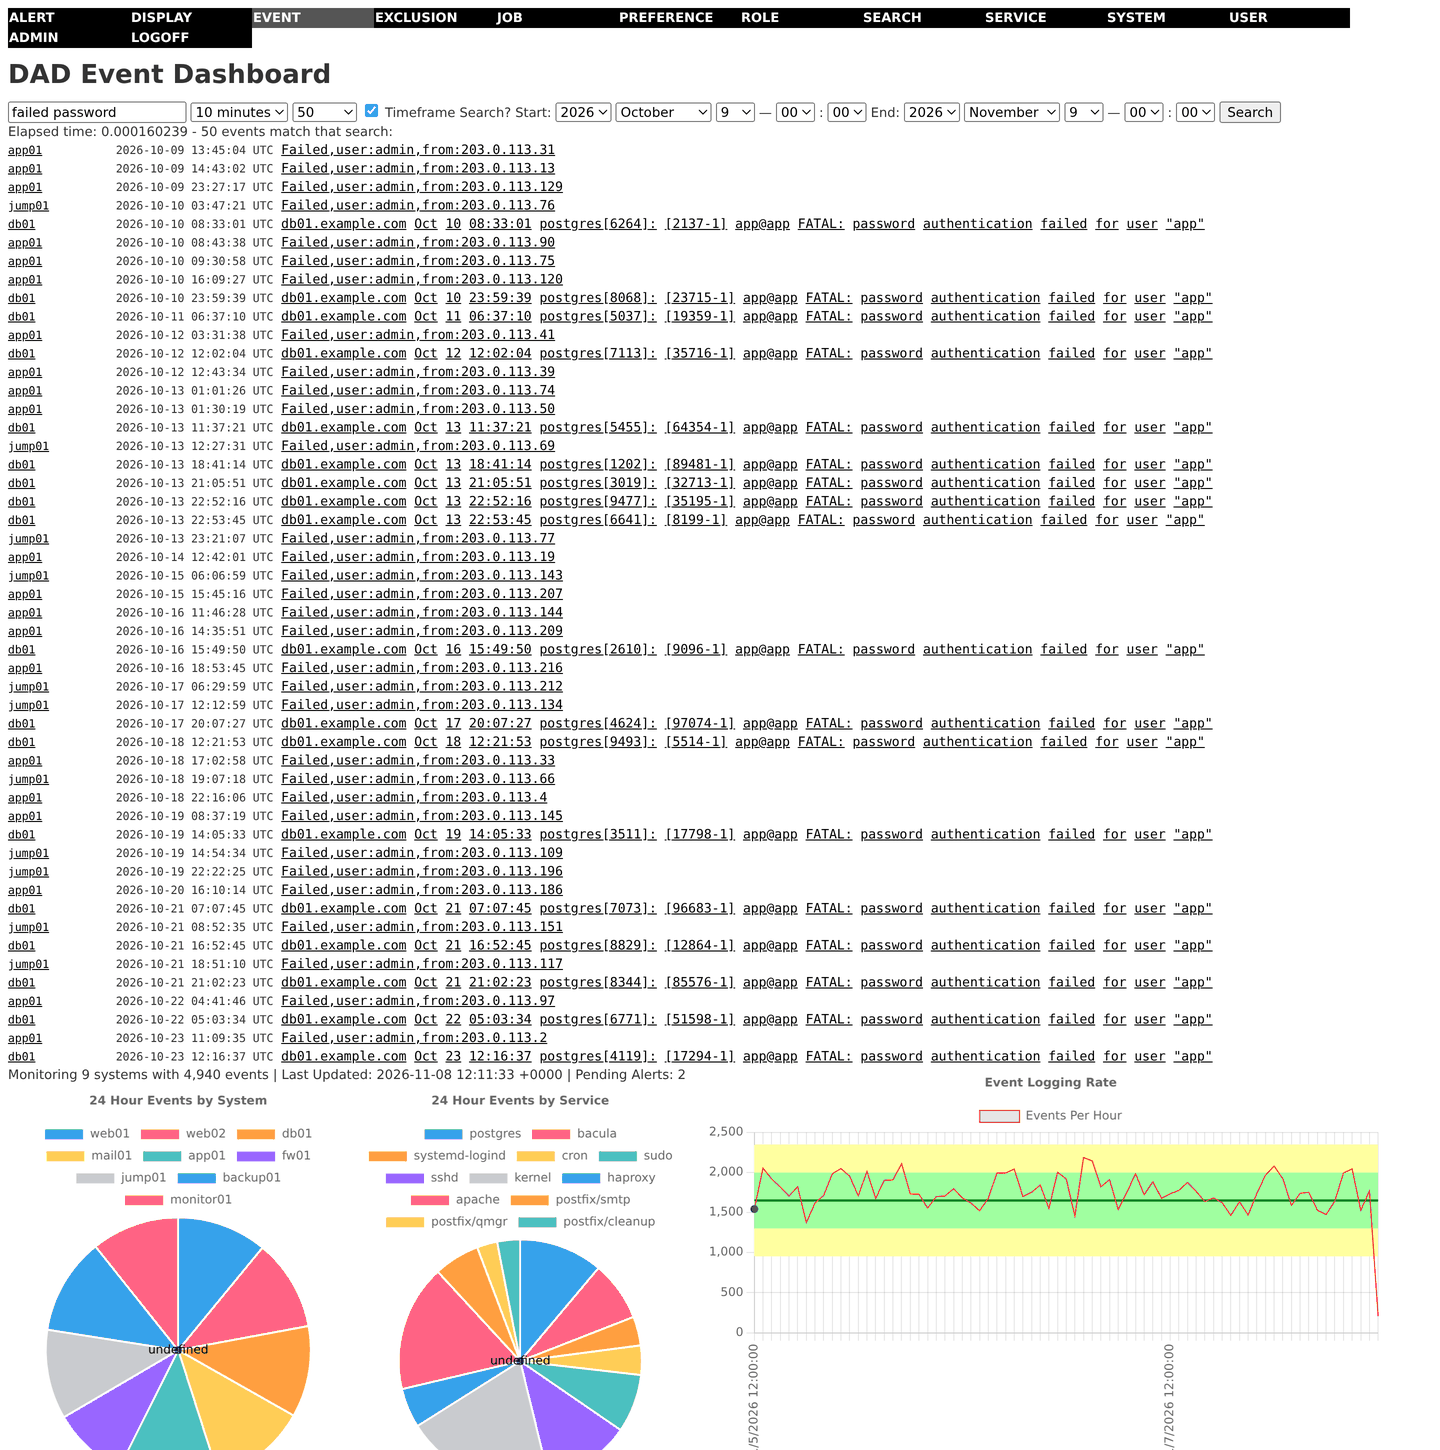
The search bar, timeframe, and result limit sit above the feed; results replace
the feed in place. Search is a word-prefix index, so failure finds
failures but never fail. Read Search before concluding a search missed
something.
Leaving Timeframe Search unticked searches the relative window from the Timeframe dropdown. Ticking it searches the absolute start/end range instead. If those date fields cannot be read, the result line says so rather than quietly answering a different question.
This toggle was broken until recently: the checkbox always submitted
timesearch_enabled[enabled]=0when unticked and the controller branched on the presence of that key, so every search from the form took the absolute-date branch with a now→now window and reported0 events match. Fixed in7e0f435(RECOMMENDATIONS §2.3). The screenshot above predates the fix and was taken by ticking the box.
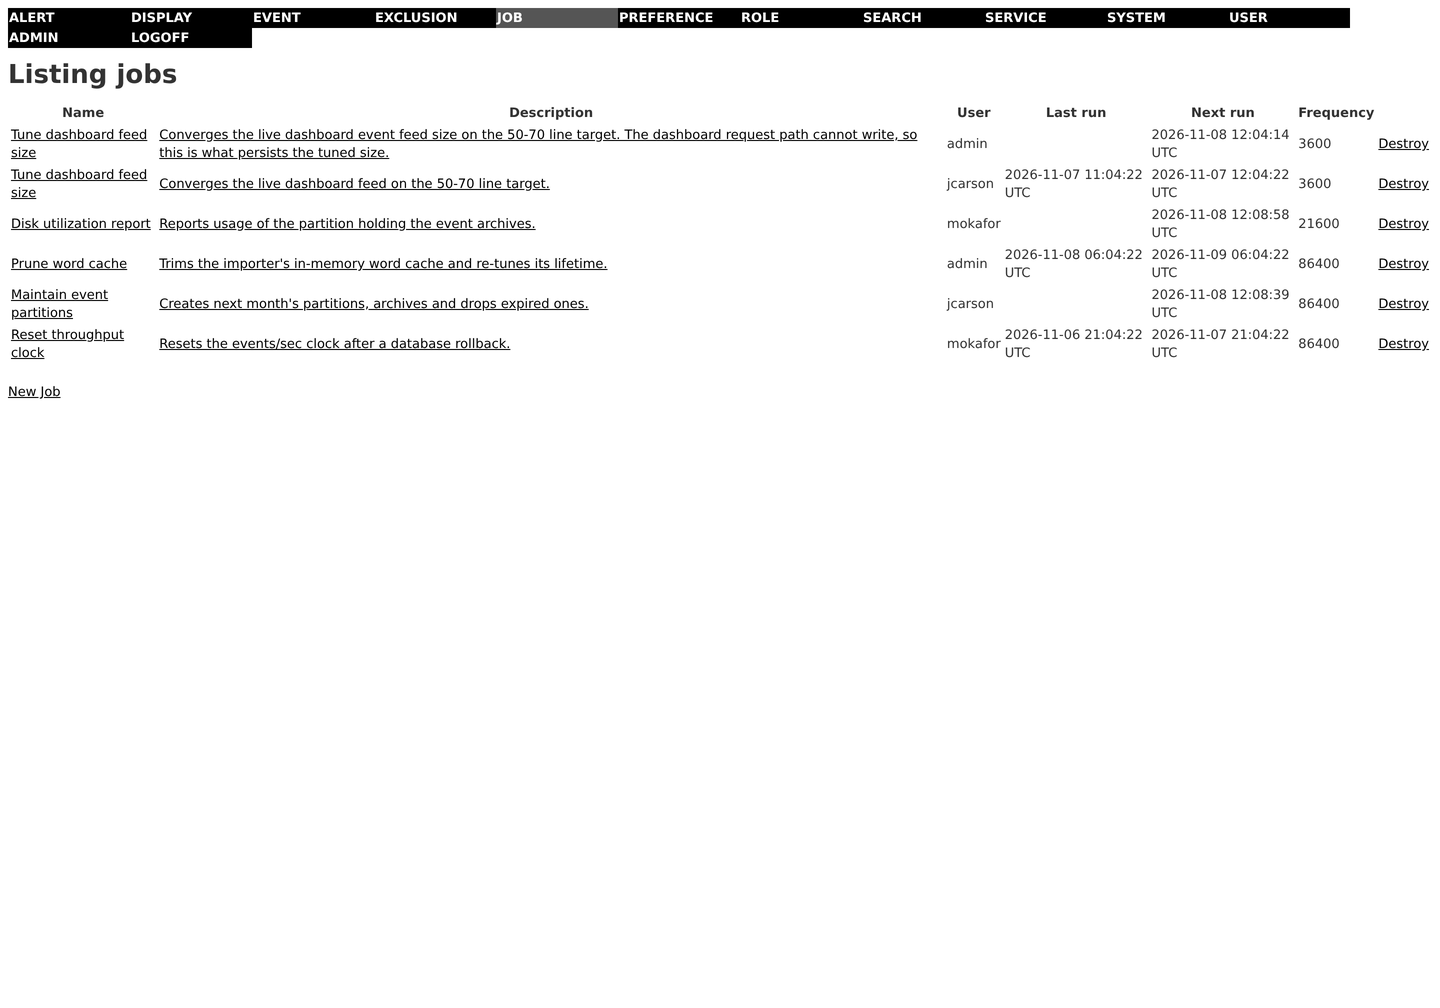
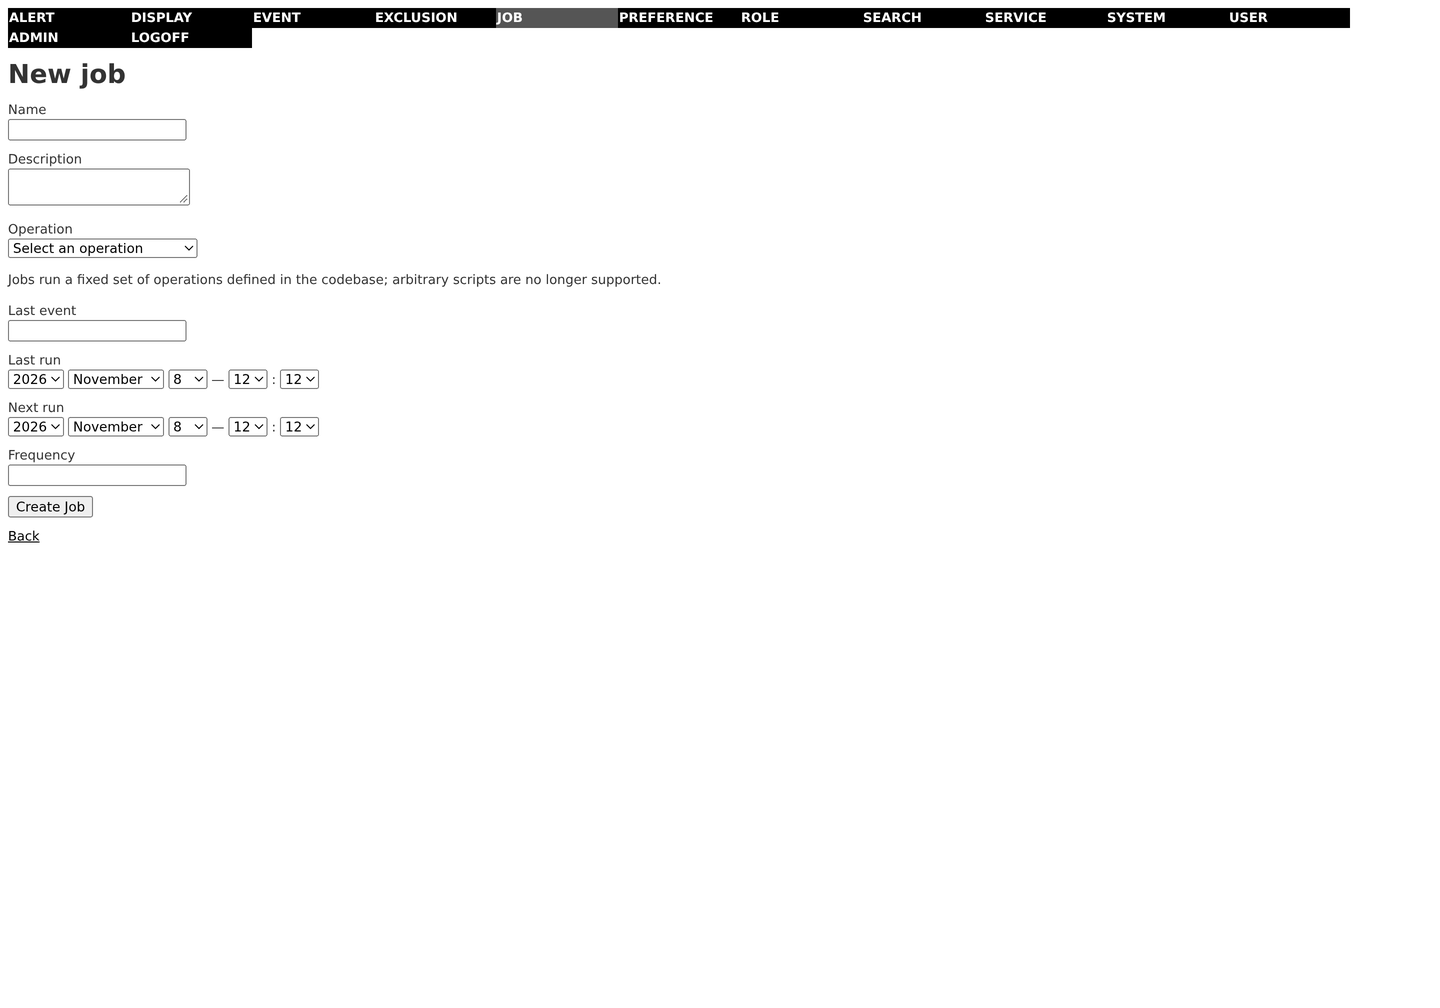
Creating a job means picking one of the registered JobHandler::HANDLERS names
from a dropdown — the form stores no code. See Jobs.
Every management index screen is paginated at 25 rows per page; ?page=N
selects one, and the line under the table reads Page 2 of 3 (64 total).
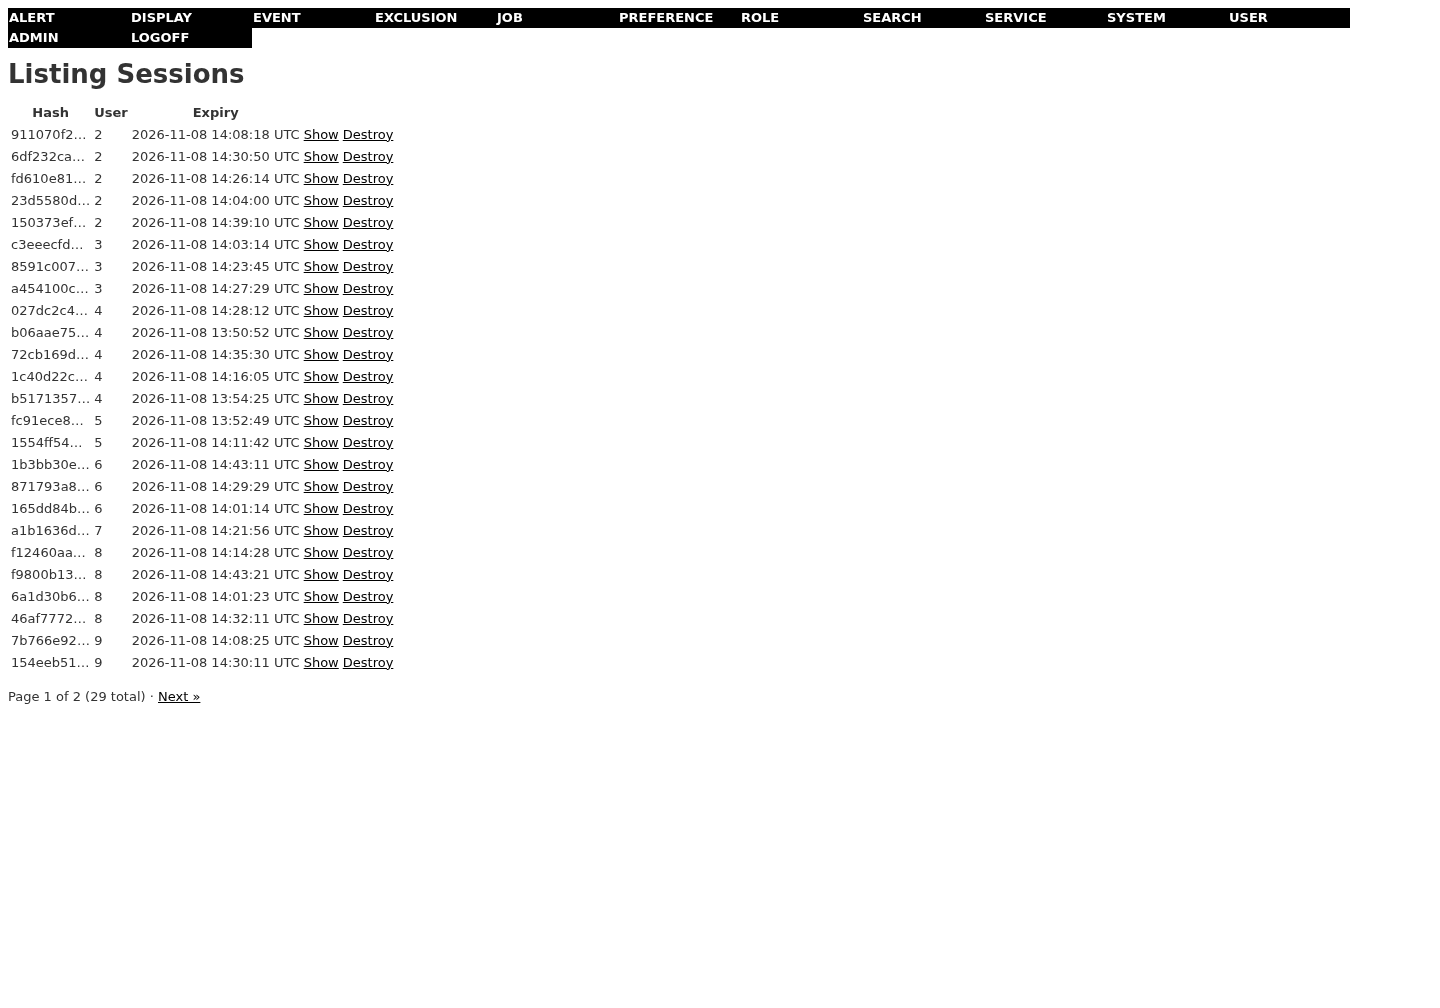
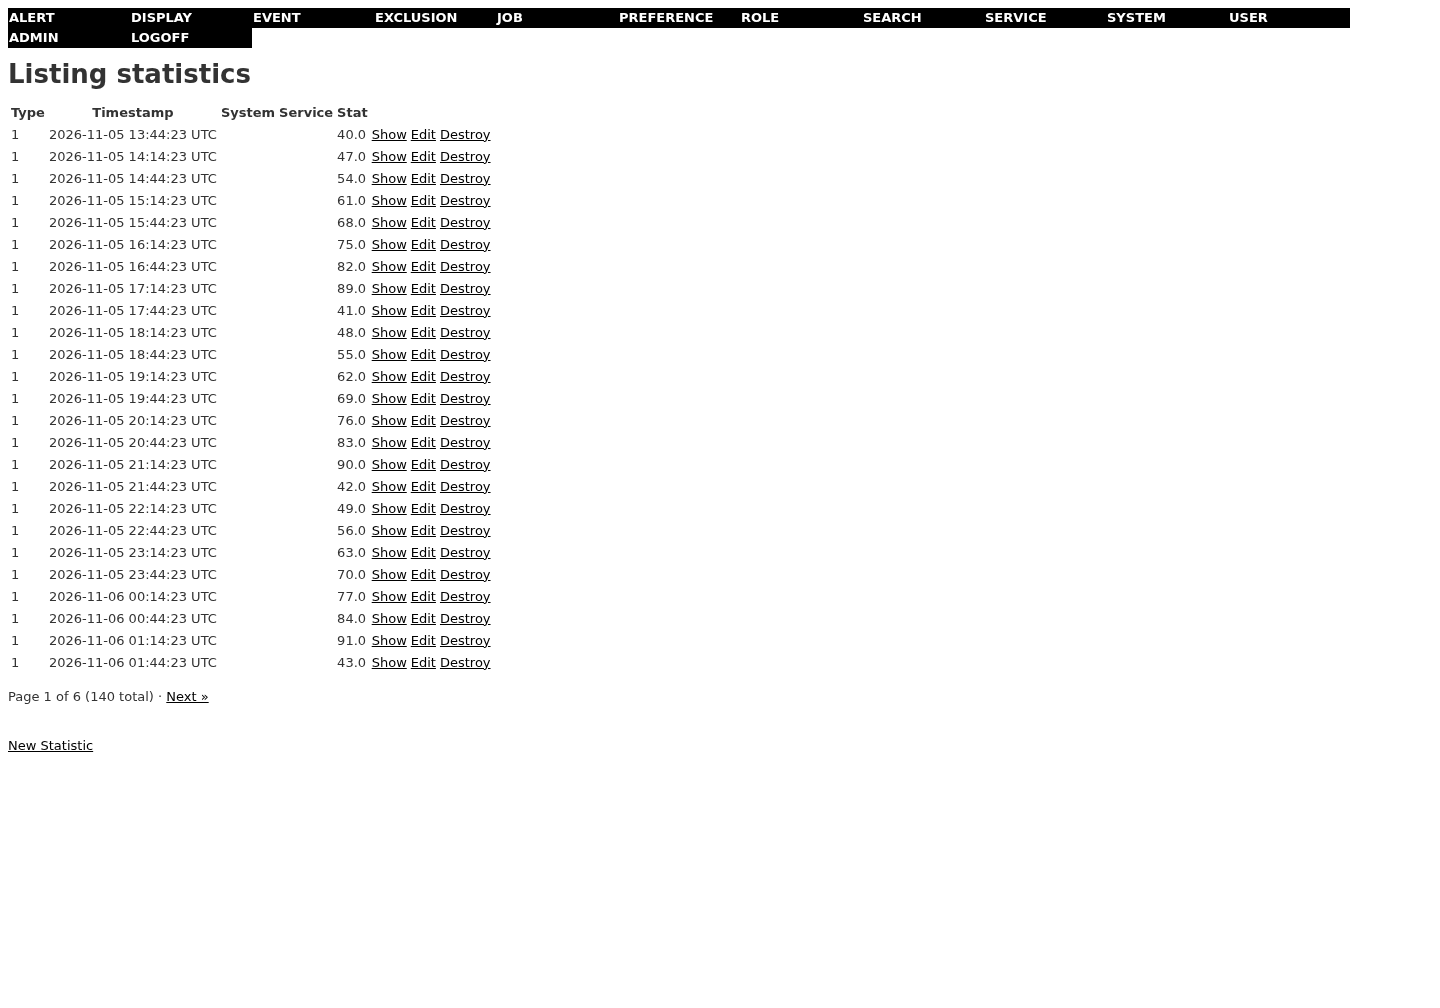
These screens used to assign a bare Model.all and render the whole table. Two of
them grow without bound — sessions through ordinary logins, and statistics, an
append-only series written by the ingestion pipeline — so they eventually stopped
rendering at all. ApplicationController#paginate plus the pagination_nav
helper replaced it on all thirteen: users, sessions, jobs, roles, rights,
preferences, comments, exclusions, searches, displays, systems, statistics,
Windows targets.
?page is clamped at both ends: a non-numeric or non-positive value falls back to
page 1, and a page past the last one is pulled back to it rather than rendering an
empty table. Pagination is hand-rolled rather than a gem — the app pins sprockets
3 and jquery-rails for asset-pipeline reasons, and a dependency is not worth
adding to page a table.
Rights are granted to roles, and roles to users. There is no per-user right.
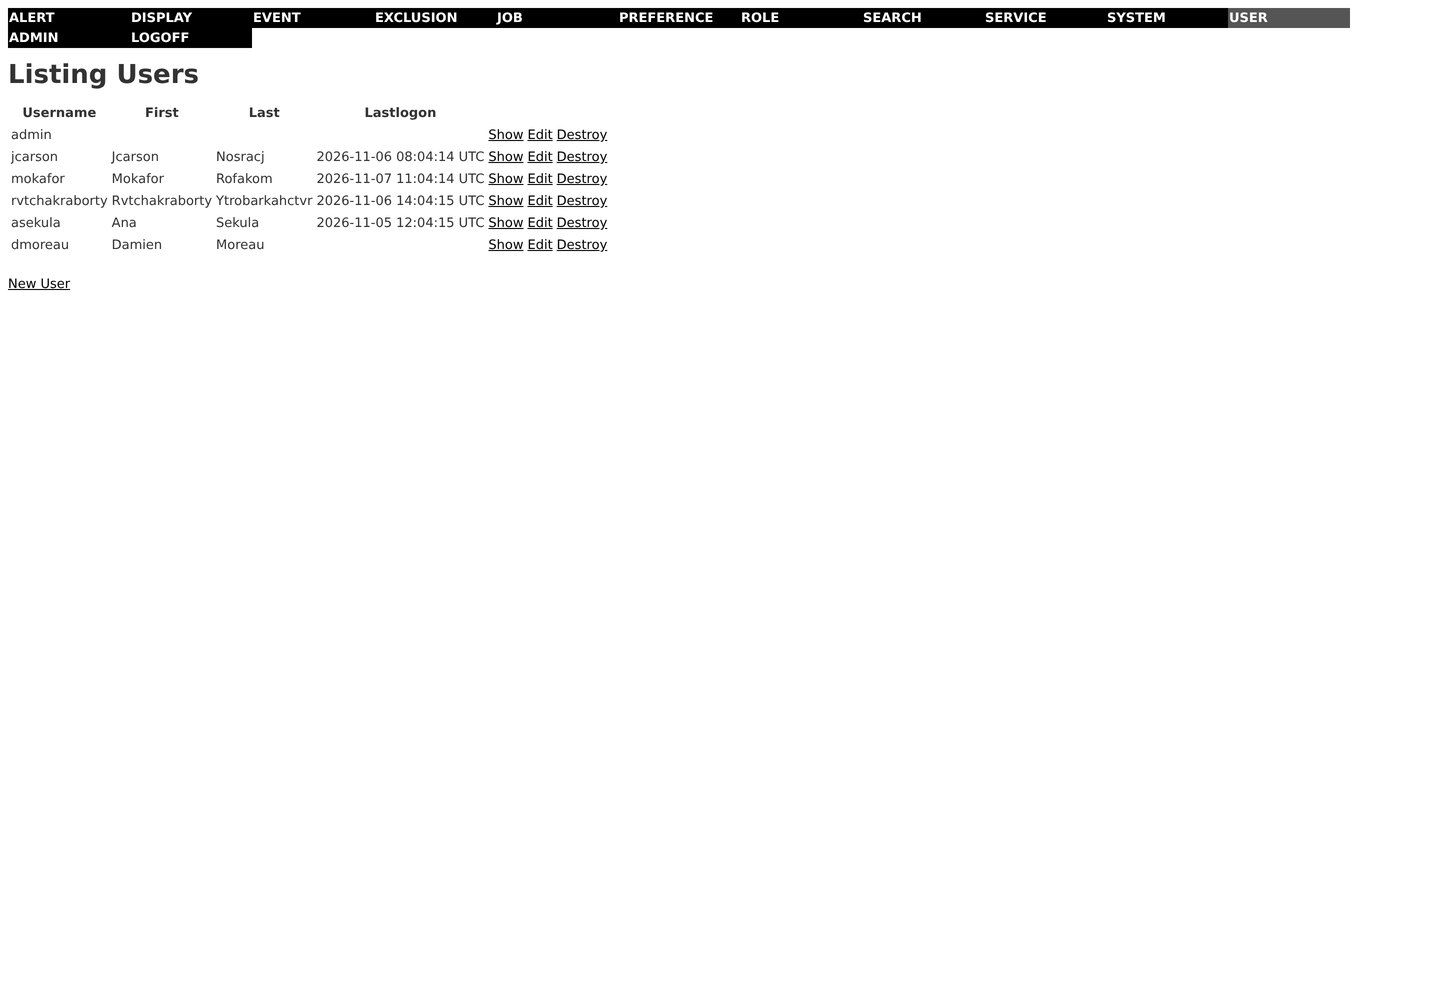
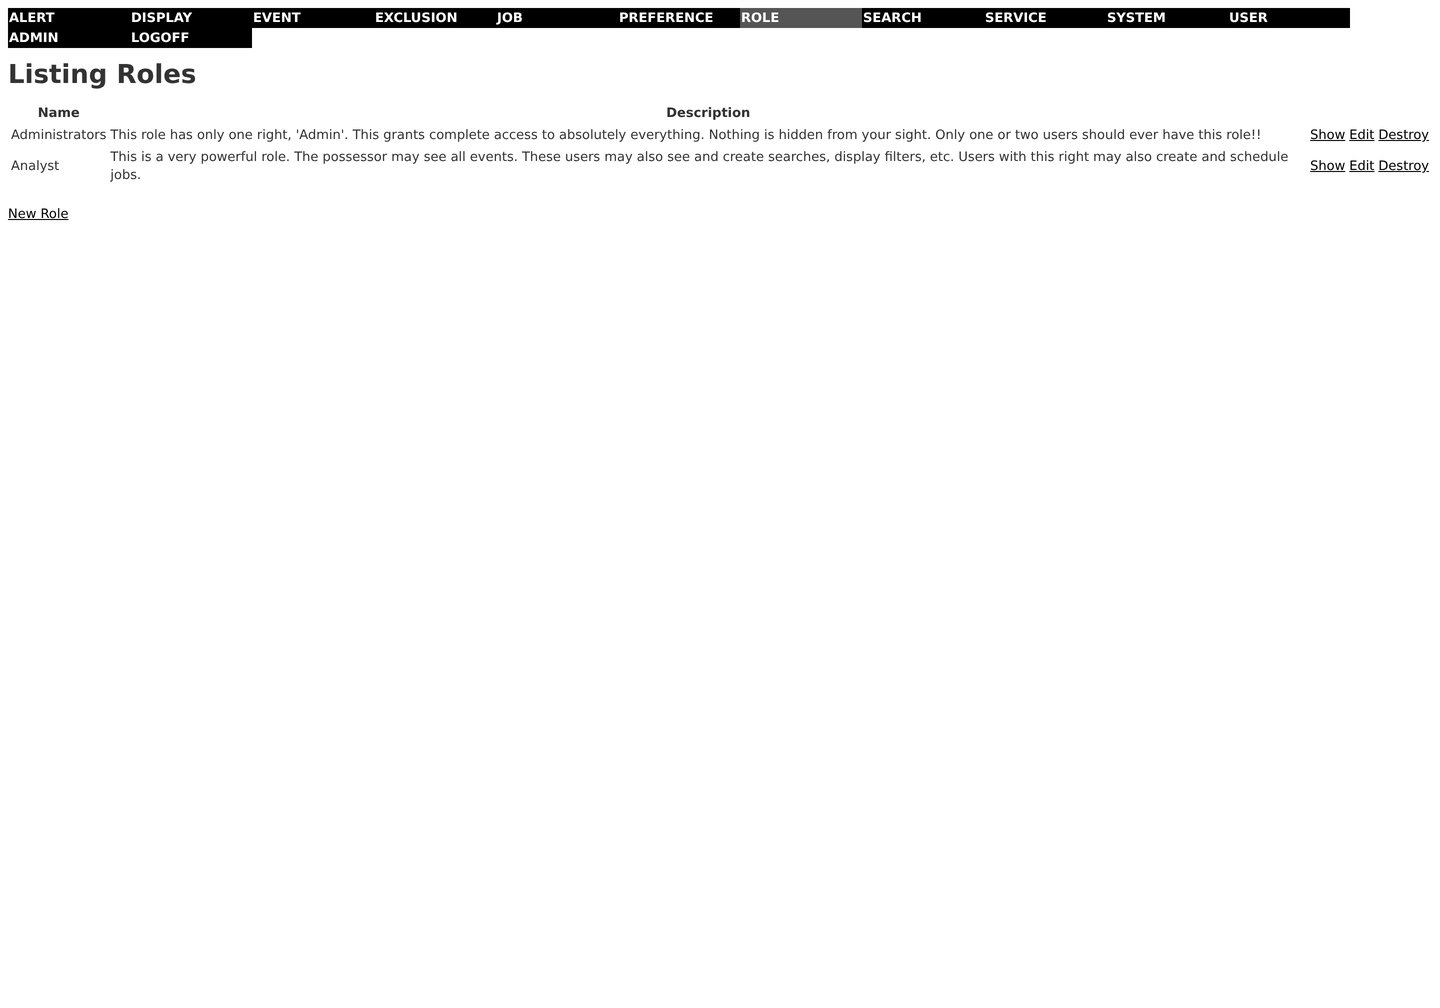
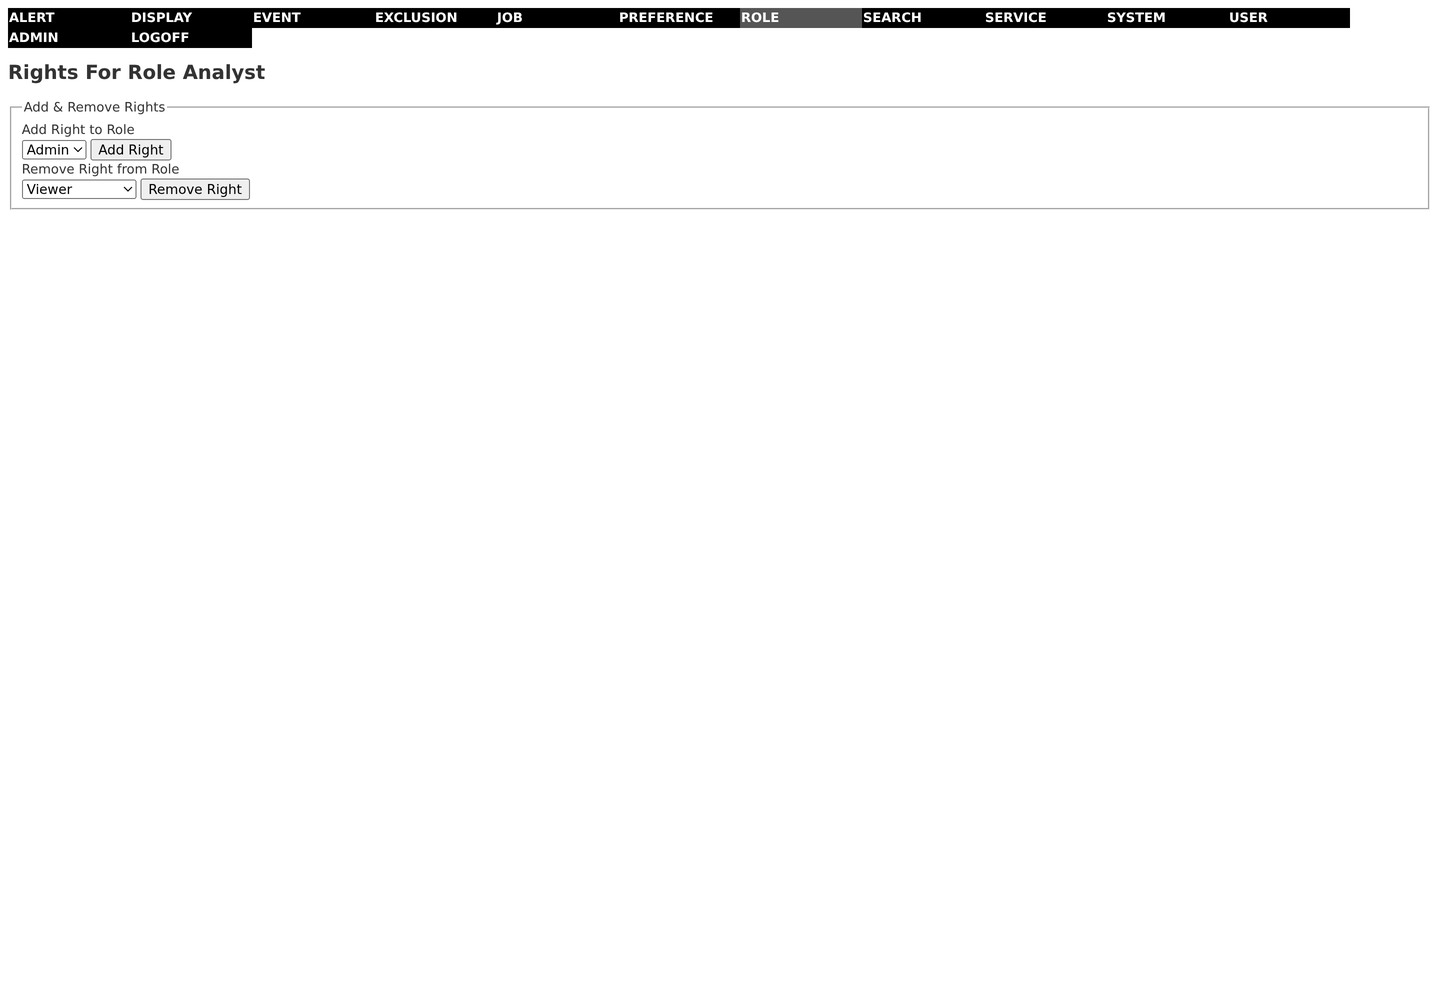
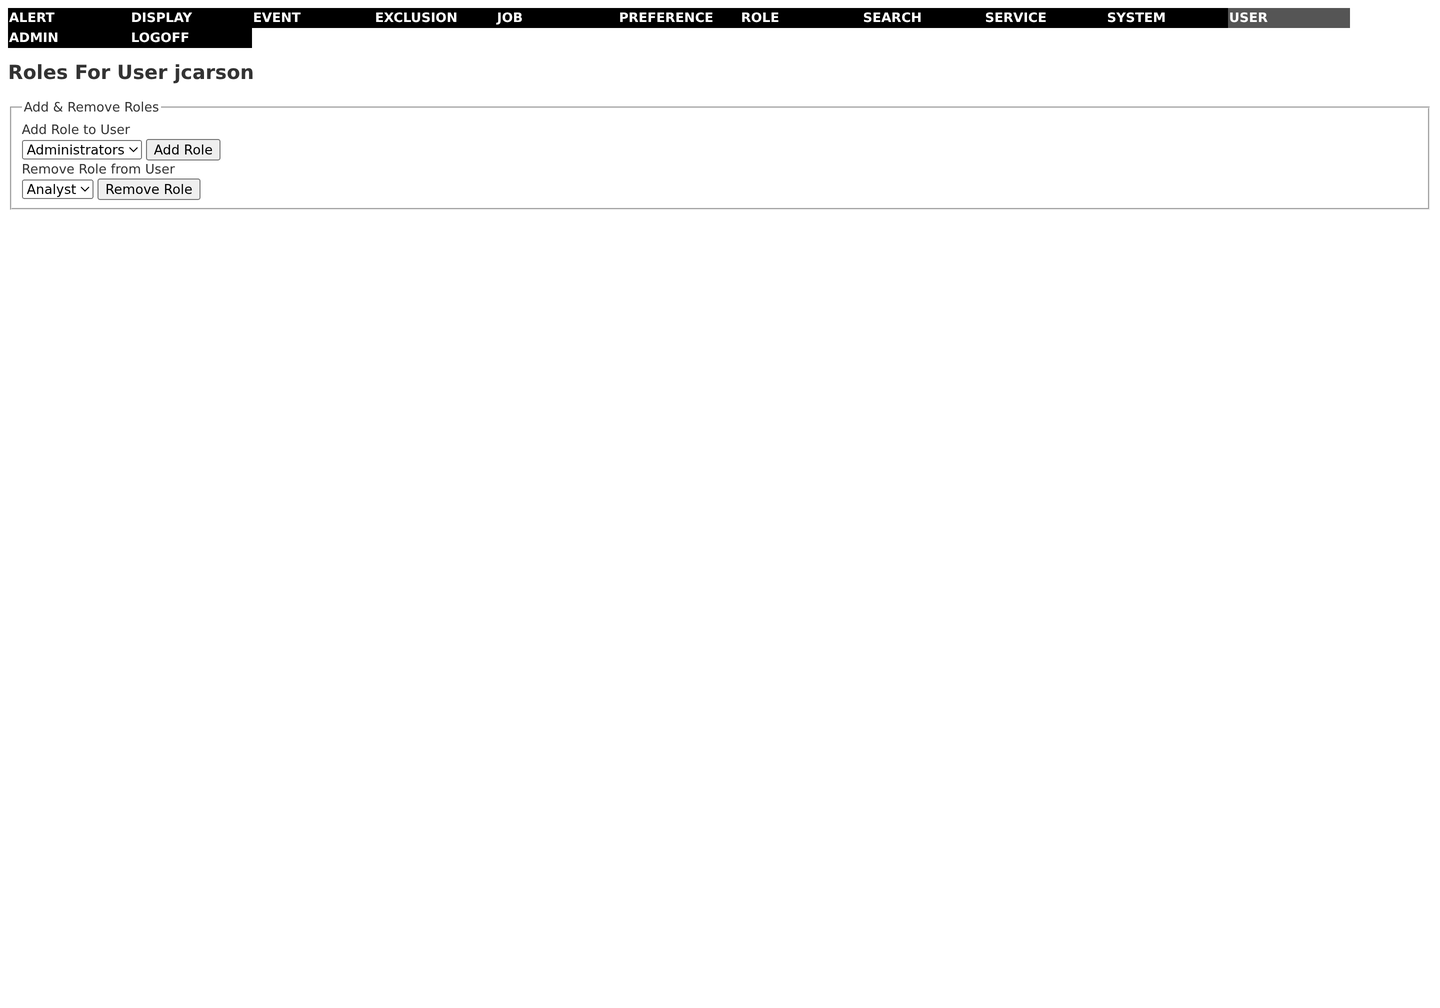
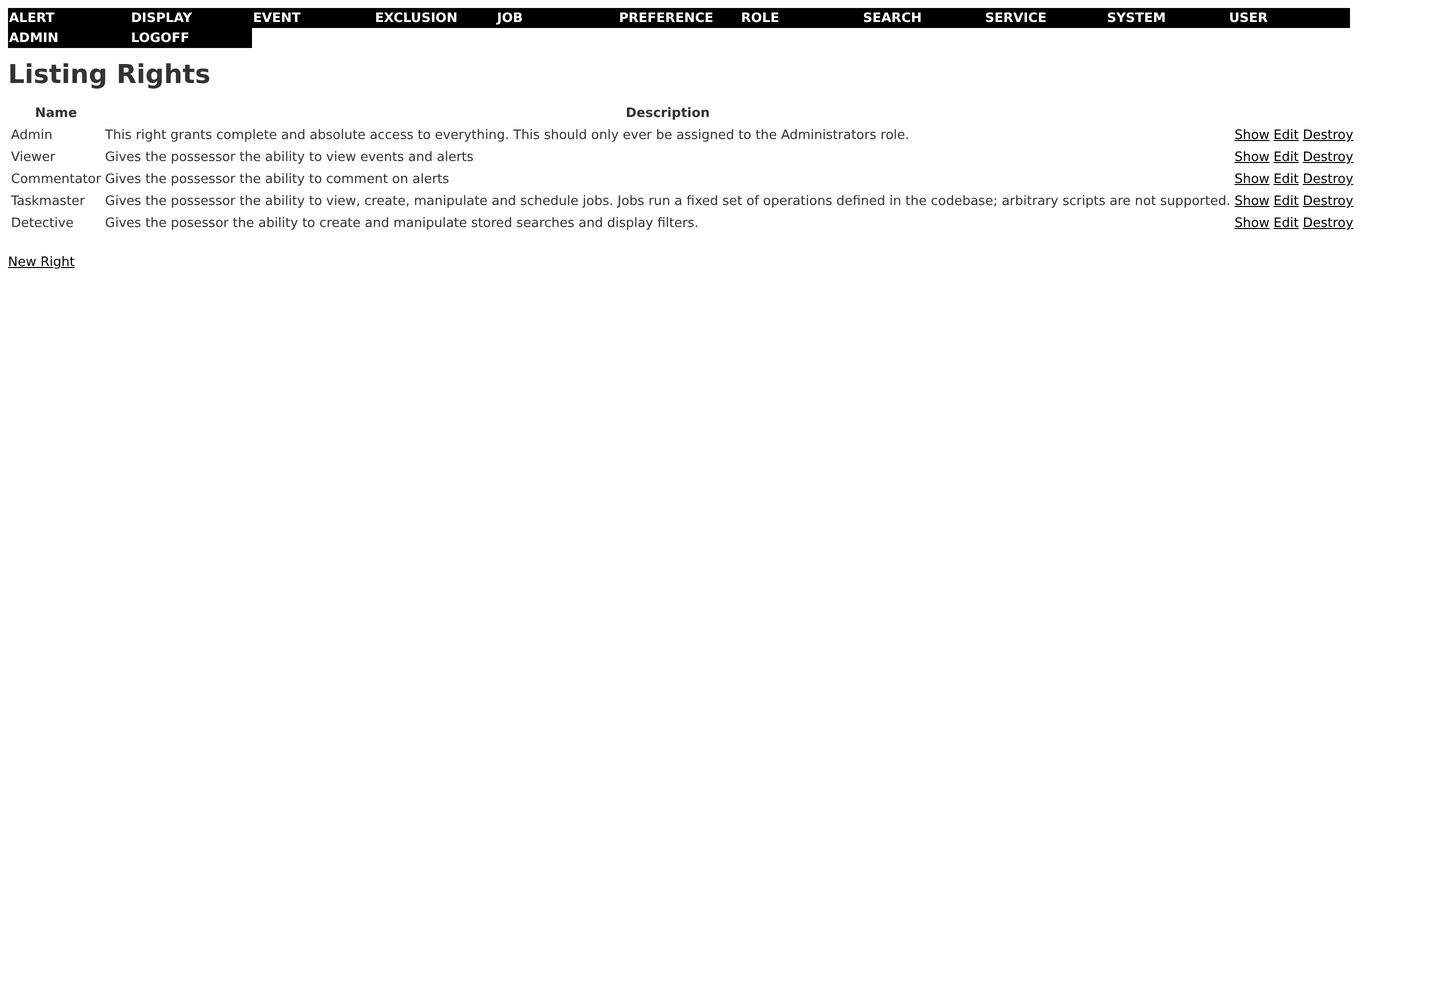
Admin unlocks everything, including these screens. A controller absent from
ApplicationController::CONTROLLER_RIGHTS is unreachable to everyone. Details in
Access Control.
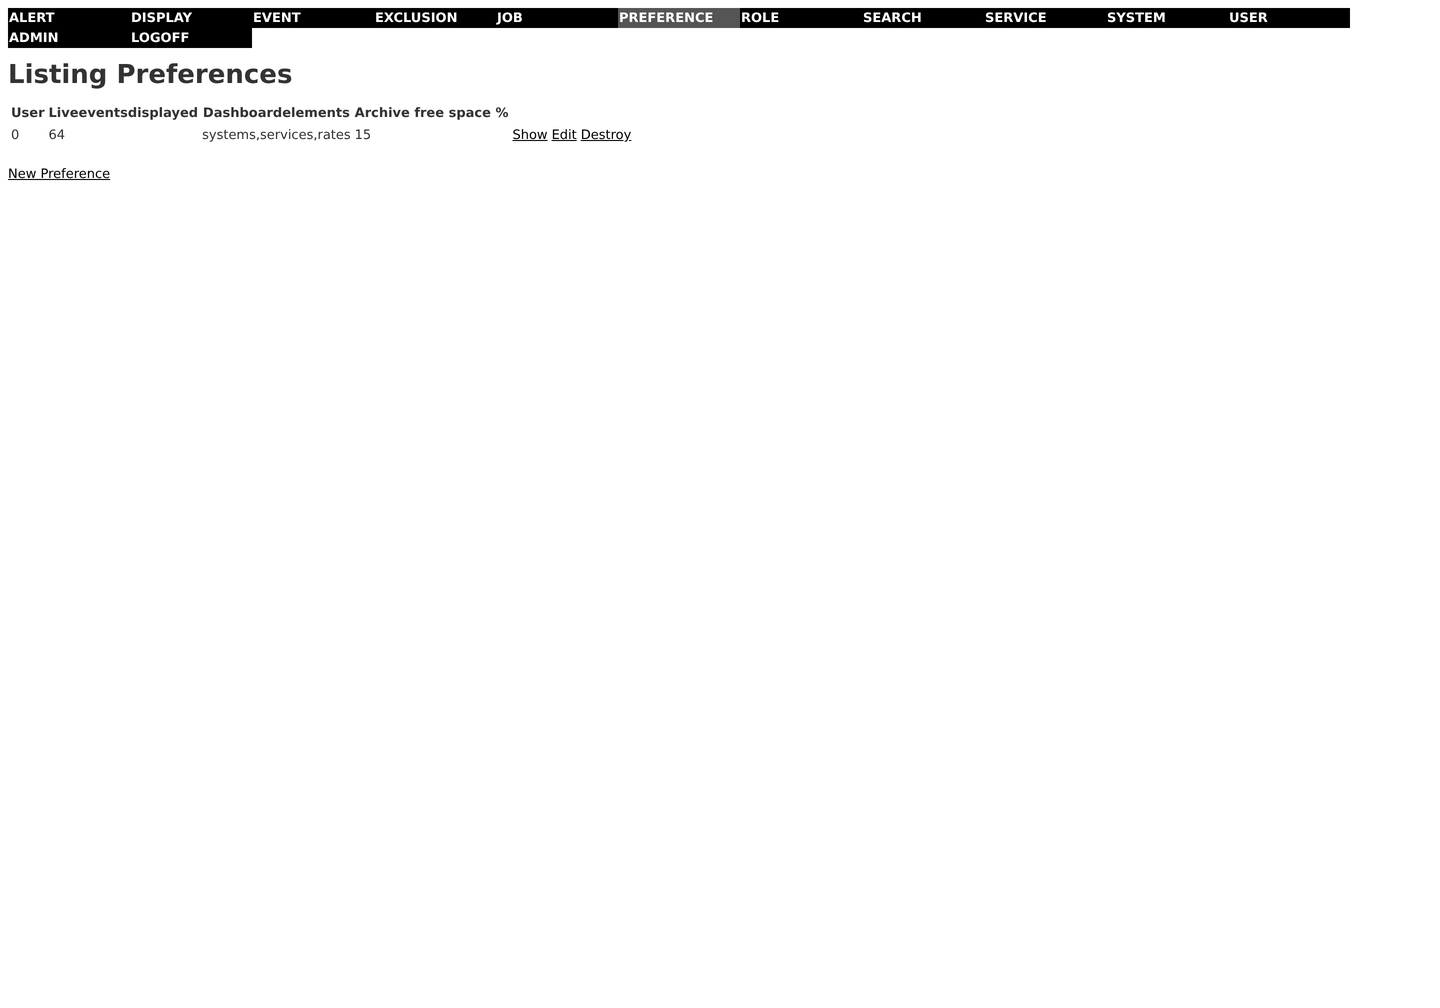
archiveFreeSpacePercent is the floor that lets DAD prune event archives when the
archive partition fills. It is off unless an admin sets it (nil or 0 means
off), it is clamped to 0..100 on write, and pruning is unrecoverable — an archive
is usually the only copy of a month the database already dropped. See
Retention and Archives.
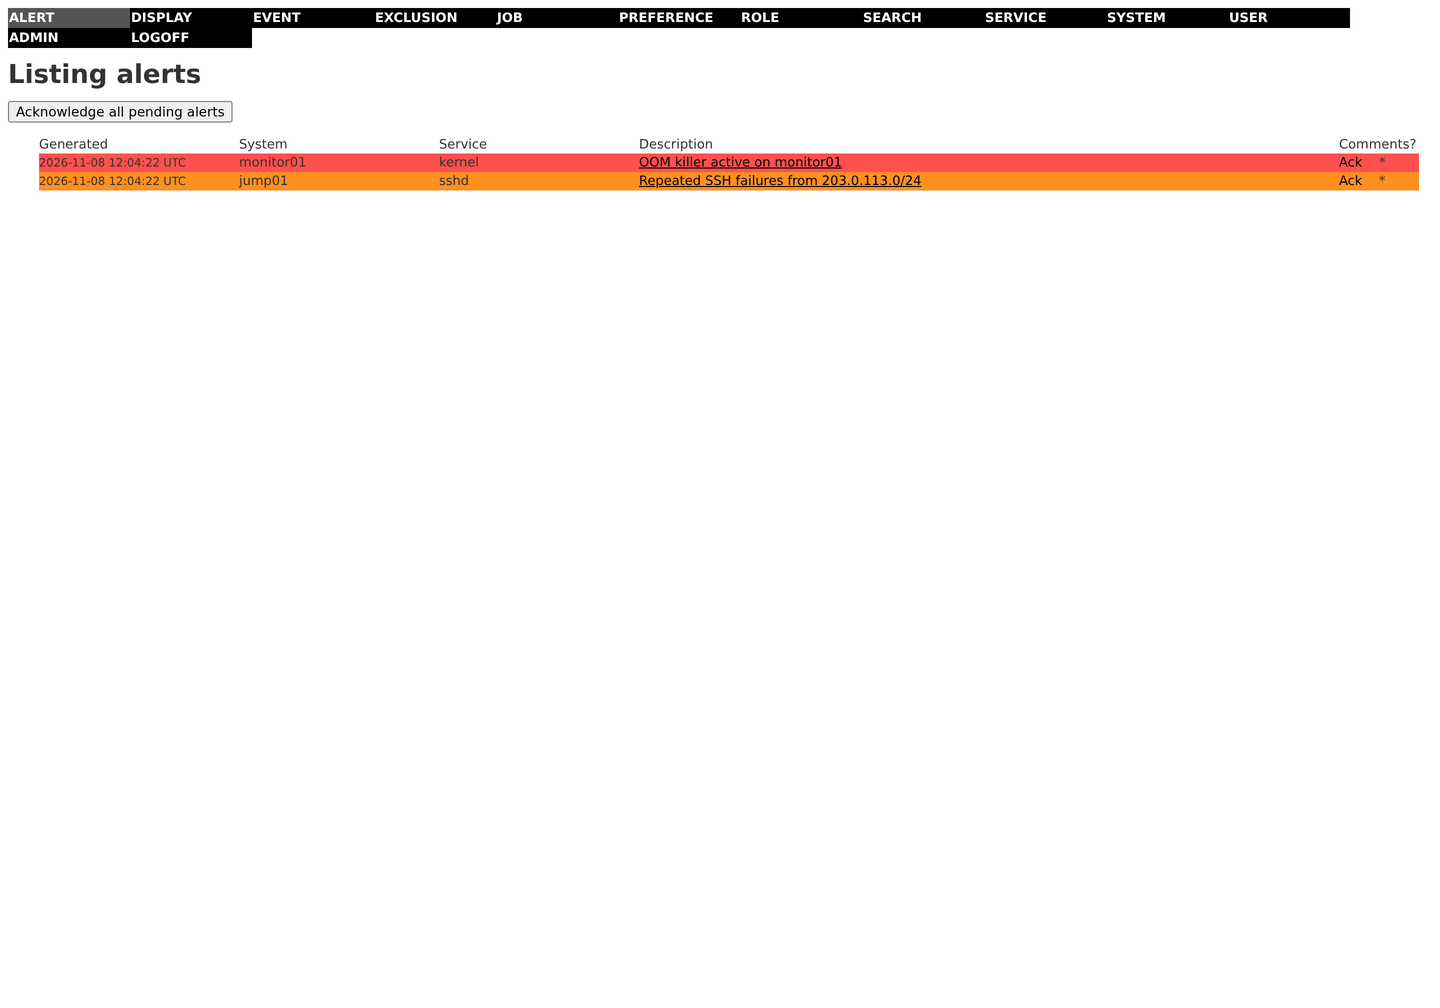
Alerts carry a criticality, an optional system and service, and the events that triggered them. Acknowledging is per-alert or all-at-once. See Statistical Alerting.
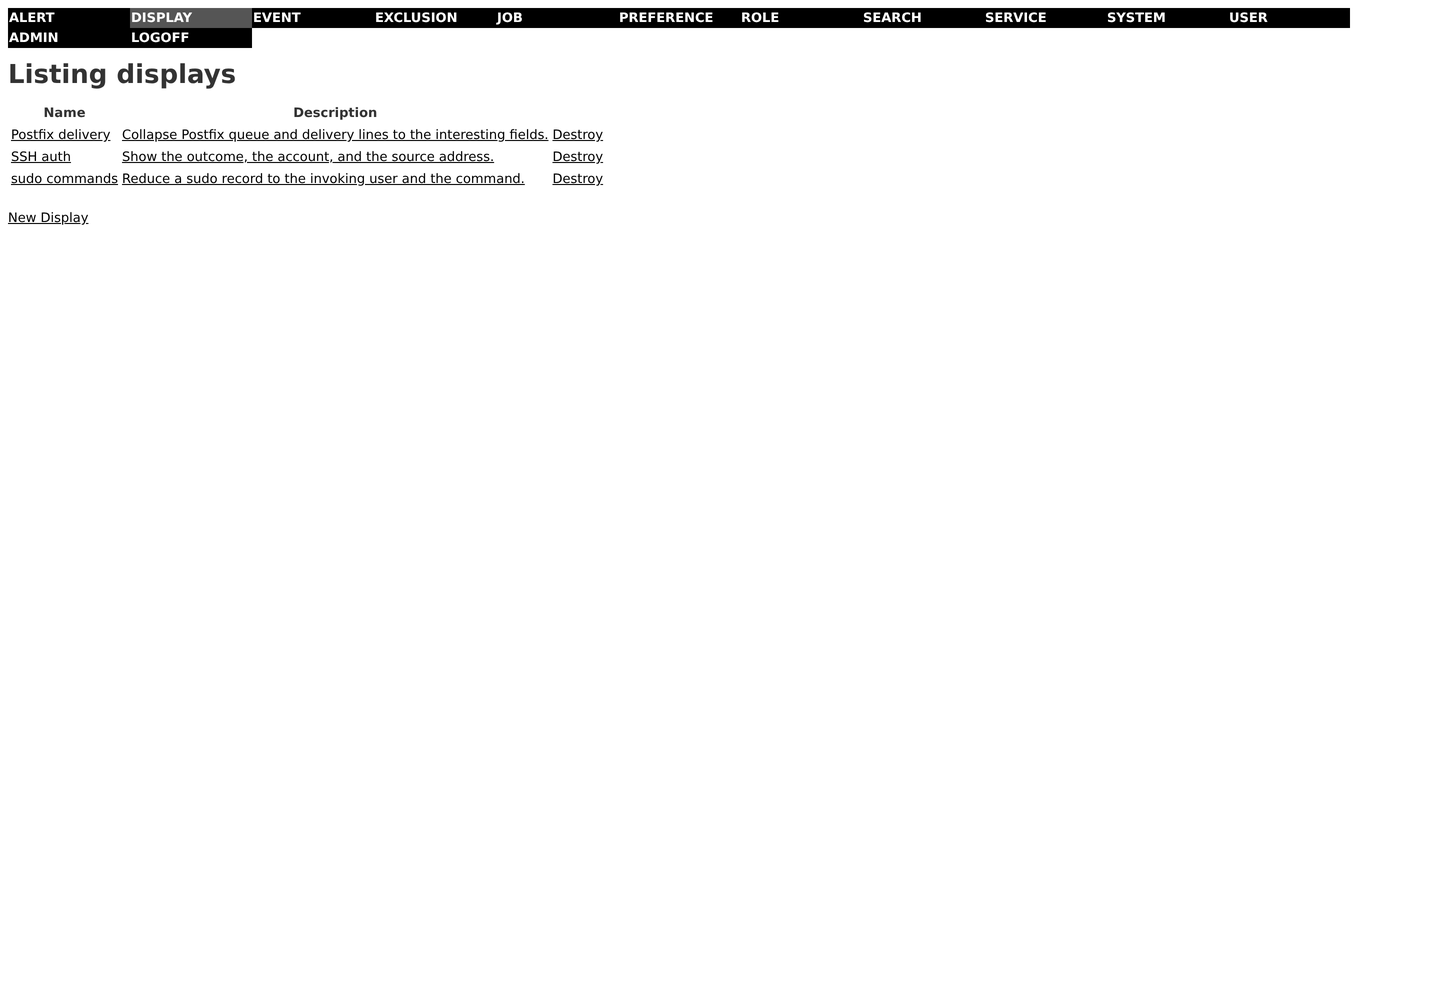
A Display reformats matching lines using a small directive language that is parsed, never evaluated. See Displays.
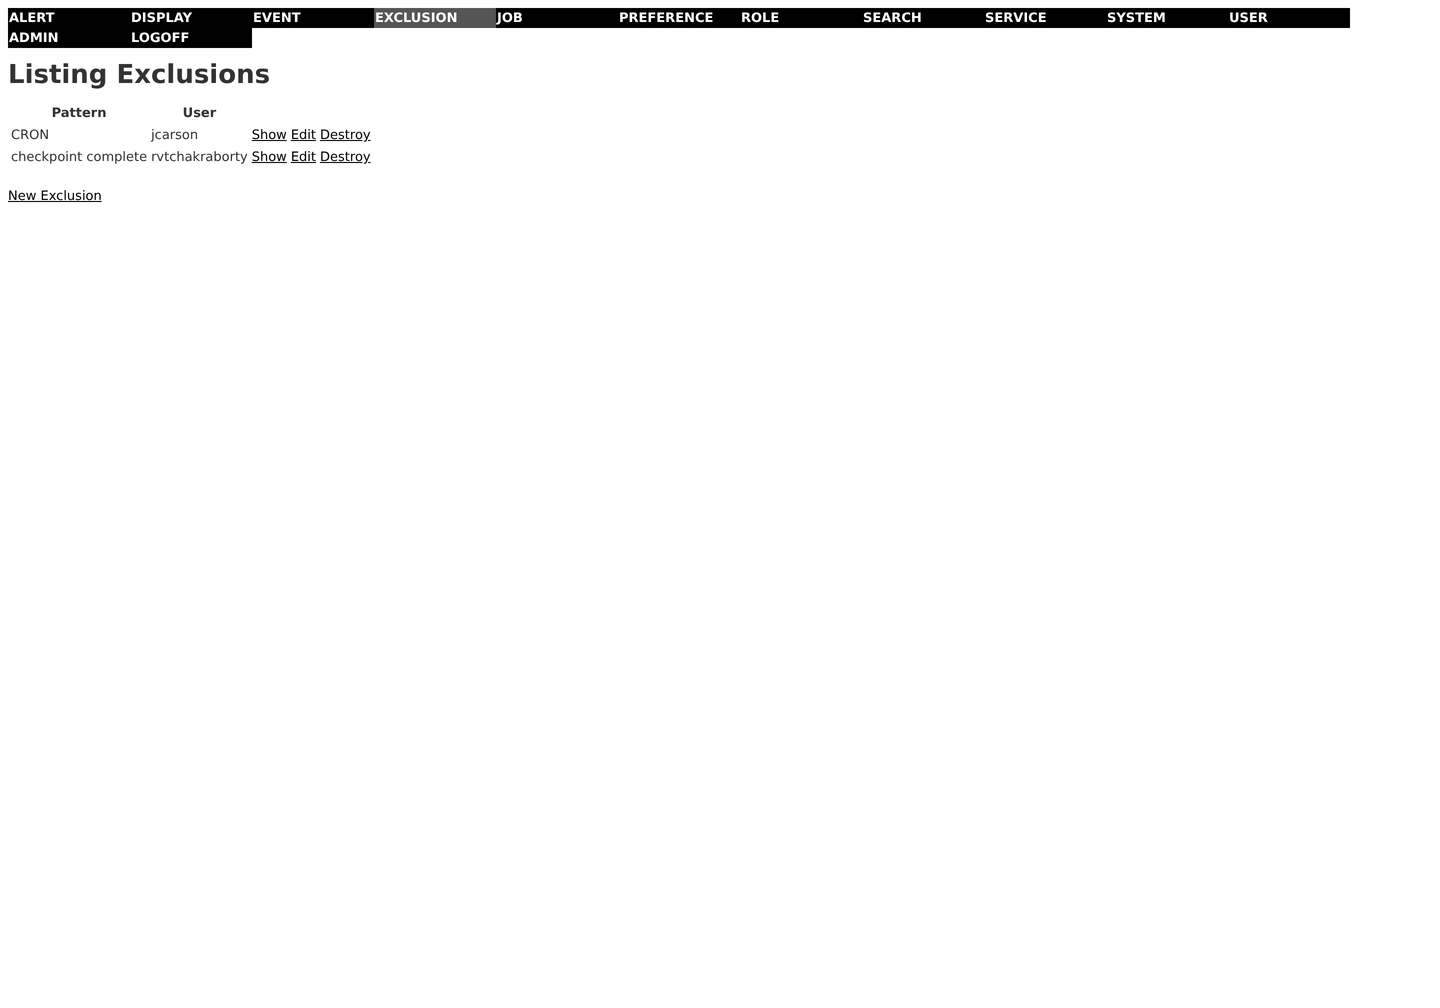
Exclusions only affect the live dashboard feed, not search. See Exclusions.
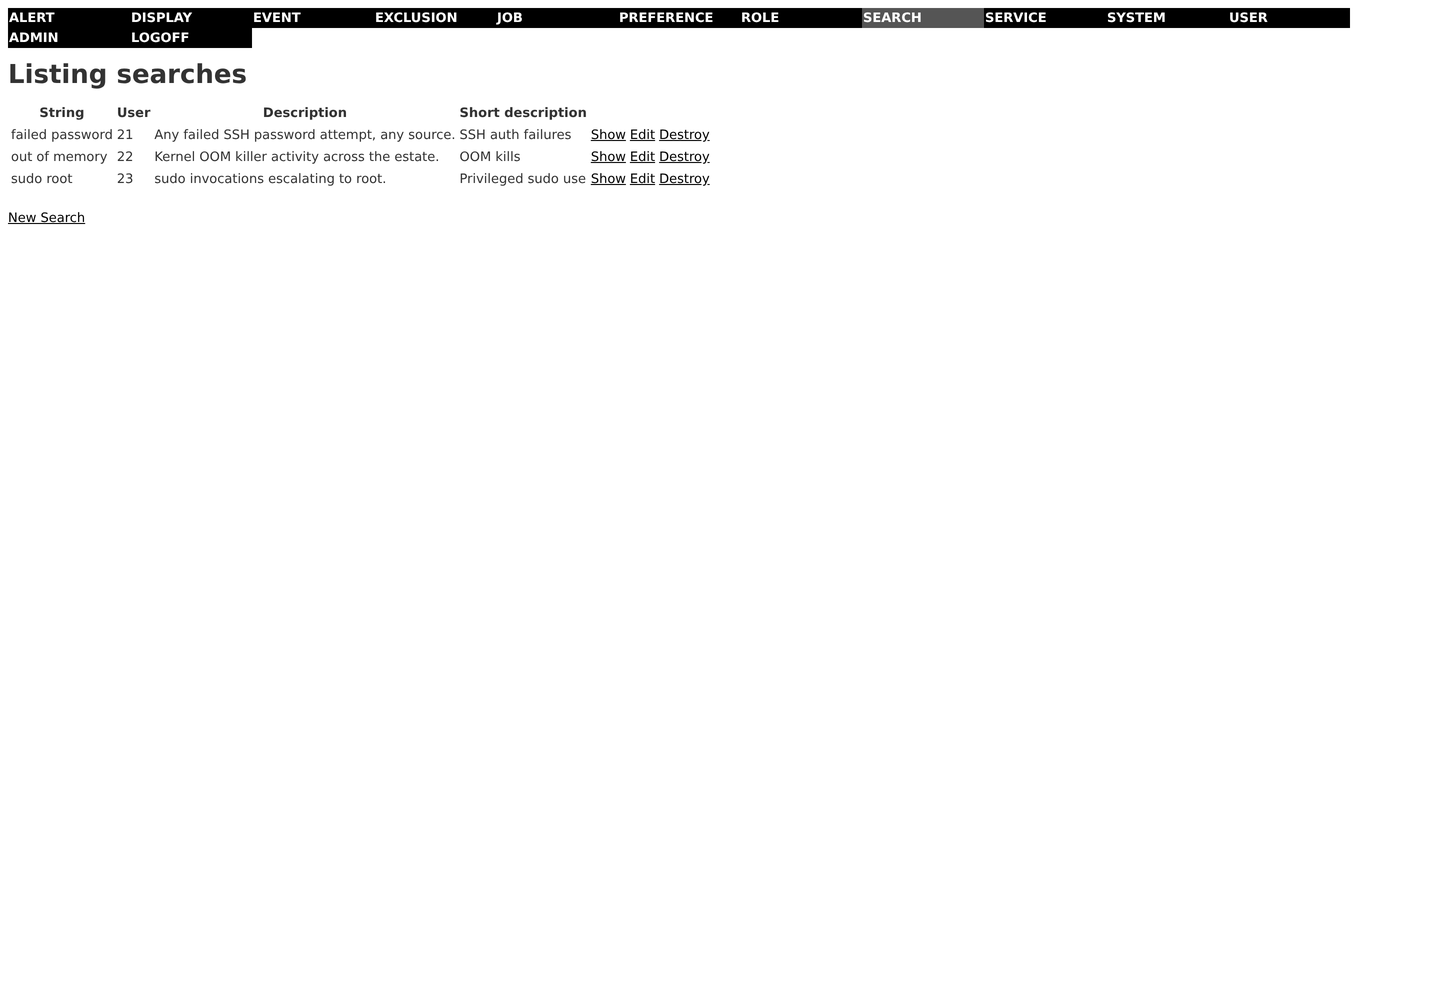
A stored search is a bookmark — a search string plus a time window. Nothing is cached. See Search.
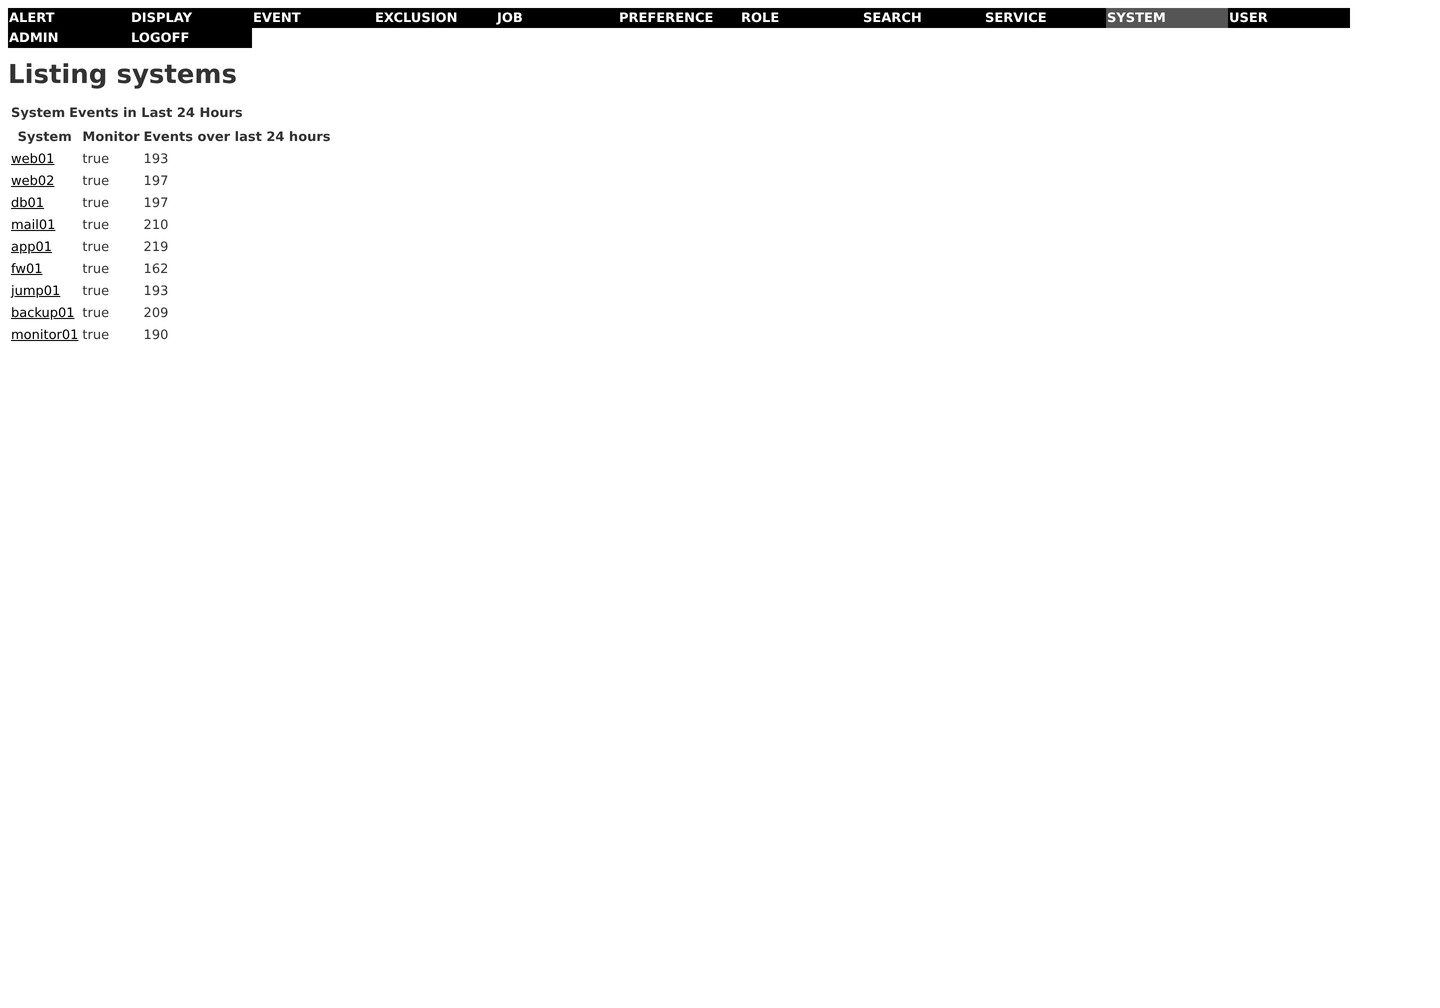
Systems are associated to incoming lines by System association rules, and drive
the per-host statistics behind the alerting recipes.
A WindowsTarget is a host DAD polls for Windows Event Log records over WinRM. The
index shows the host, its priority band, the channels it reads, whether polling is
enabled, when it is next due, and the status of its last poll — which is where a
credential or channel-permission problem becomes visible. See Windows Events.
The row is deliberately not a System. A System is derived from an incoming
line and describes a source of events; a WindowsTarget is outbound configuration
holding a credential and naming a host this server connects to. They are different
kinds of record with different rights attached.
The show page is where the adaptive scheduling becomes legible: the band's floor and ceiling, the interval currently in force, the next interval, the smoothed events/second driving it, and the last poll's event count. That is what makes it possible to answer "why was this host not polled for 20 minutes" without reading code.
Two things the forms do that are easy to miss:
- The password field is always blank on edit, and submitting it blank leaves the stored credential alone. The credential is encrypted at rest and is never rendered back to a browser, so there is nothing to pre-fill.
- Polling on demand ("poll now") runs a poll inline rather than queueing one, so the result comes back in the page. It is the fast way to check that credentials and channel selection work without waiting for a scheduled cycle.
PollingPriority bands are listed from the Windows targets screen. A Viewer can
read both; only an Admin can change either. See Access Control.
Admin-only, including reading them. See Access Control.
An ActiveDirectoryConnection is a directory DAD can query for the Windows hosts
it should poll: host, port, bind DN and password, search base, and the priority
band, channels and WinRM credential applied to whatever it finds. The index lists
each connection with its host:port, whether a polling credential is stored, and
the last query status. The show page spells the port out — dc01…:636 (LDAPS)
versus (StartTLS on port 389) — rather than leaving the number to be interpreted,
and warns in place when no polling credential is stored, because a connection
without one imports hosts that can never poll.
The import screen is deliberately two pages. The first picks a directory and whether to look at workstations, servers, or both. The second is the review page: one row per machine the directory returned that is not already a target, with its operating system, its class, and a domain controller marker. Ordinary hosts arrive pre-checked; hosts whose operating system DAD cannot recognise as Windows arrive unchecked, so importing one is something you opt into rather than something that happens because you clicked a submit button.
Already-present hosts are listed for context but never rendered as a checkbox, so the form cannot offer to add a machine twice.
Two things the screens do that are easy to miss:
- Both password fields are always blank on edit, and submitting them blank leaves the stored credential alone — same convention as the Windows target form.
- After an import, the Windows targets screen reports what was added, what was skipped, and how many addresses were ignored because the query never returned them. That is the visible half of a boundary enforced server-side; see Active Directory Import.
Import history hangs off the connection's show page rather than having a nav tab of its own. See Access Control for why.