This is the first project submission for the Data Engineering Nanodegree. This project consists on putting into practice the following concepts:
- Data modeling with Postgres
- Database star schema created
- ETL pipeline using Python
A startup called Sparkify wants to analyze the data they've been collecting on songs and user activity on their new music streaming app. The analytics team is particularly interested in understanding what songs users are listening to. Currently, they don't have an easy way to query their data, which resides in a directory of JSON logs on user activity on the app, as well as a directory with JSON metadata on the songs in their app. Your role is to create a database schema and ETL pipeline for this analysis.
- Song Dataset: The first dataset is a subset of real data from the Million Song Dataset. Each file is in JSON format and contains metadata about a song and the artist of that song. The files are partitioned by the first three letters of each song's track ID. For example, here are file paths to two files in this dataset.
song_data/A/B/C/TRABCEI128F424C983.json
song_data/A/A/B/TRAABJL12903CDCF1A.json
And below is an example of what a single song file, TRAABJL12903CDCF1A.json, looks like.
{"num_songs": 1, "artist_id": "ARJIE2Y1187B994AB7", "artist_latitude": null, "artist_longitude": null, "artist_location": "", "artist_name": "Line Renaud", "song_id": "SOUPIRU12A6D4FA1E1", "title": "Der Kleine Dompfaff", "duration": 152.92036, "year": 0}
- Log datasets: The second dataset consists of log files in JSON format generated by this event simulator based on the songs in the dataset above. These simulate activity logs from a music streaming app based on specified configurations. The log files in the dataset you'll be working with are partitioned by year and month. For example, here are filepaths to two files in this dataset.
log_data/2018/11/2018-11-12-events.json
log_data/2018/11/2018-11-13-events.json
And below is an example of what the data in a log file, 2018-11-12-events.json, looks like.
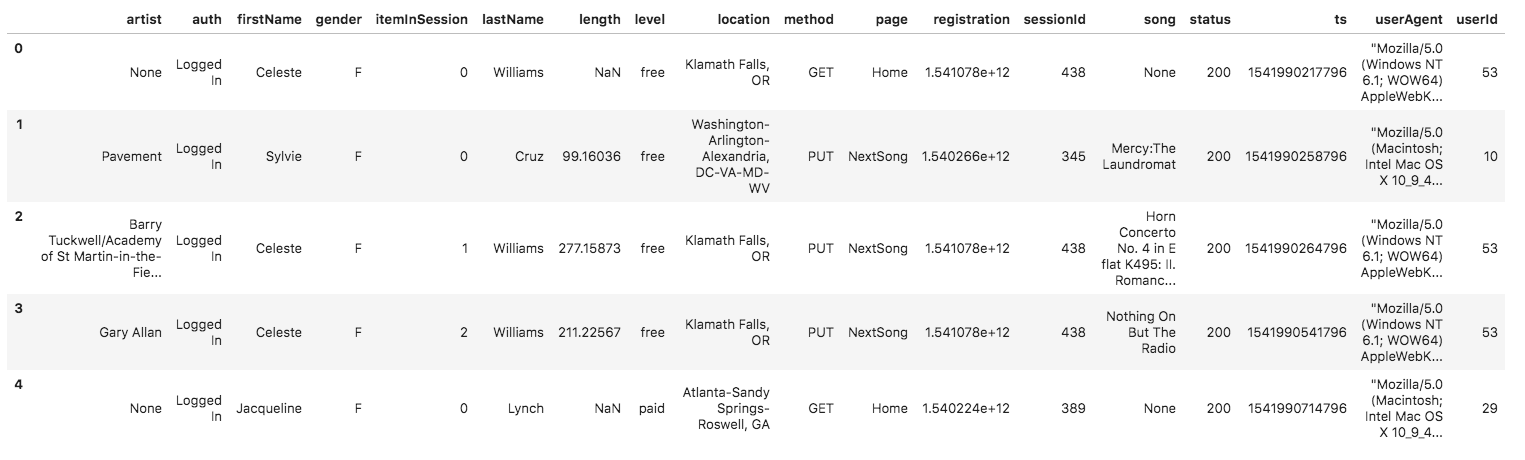
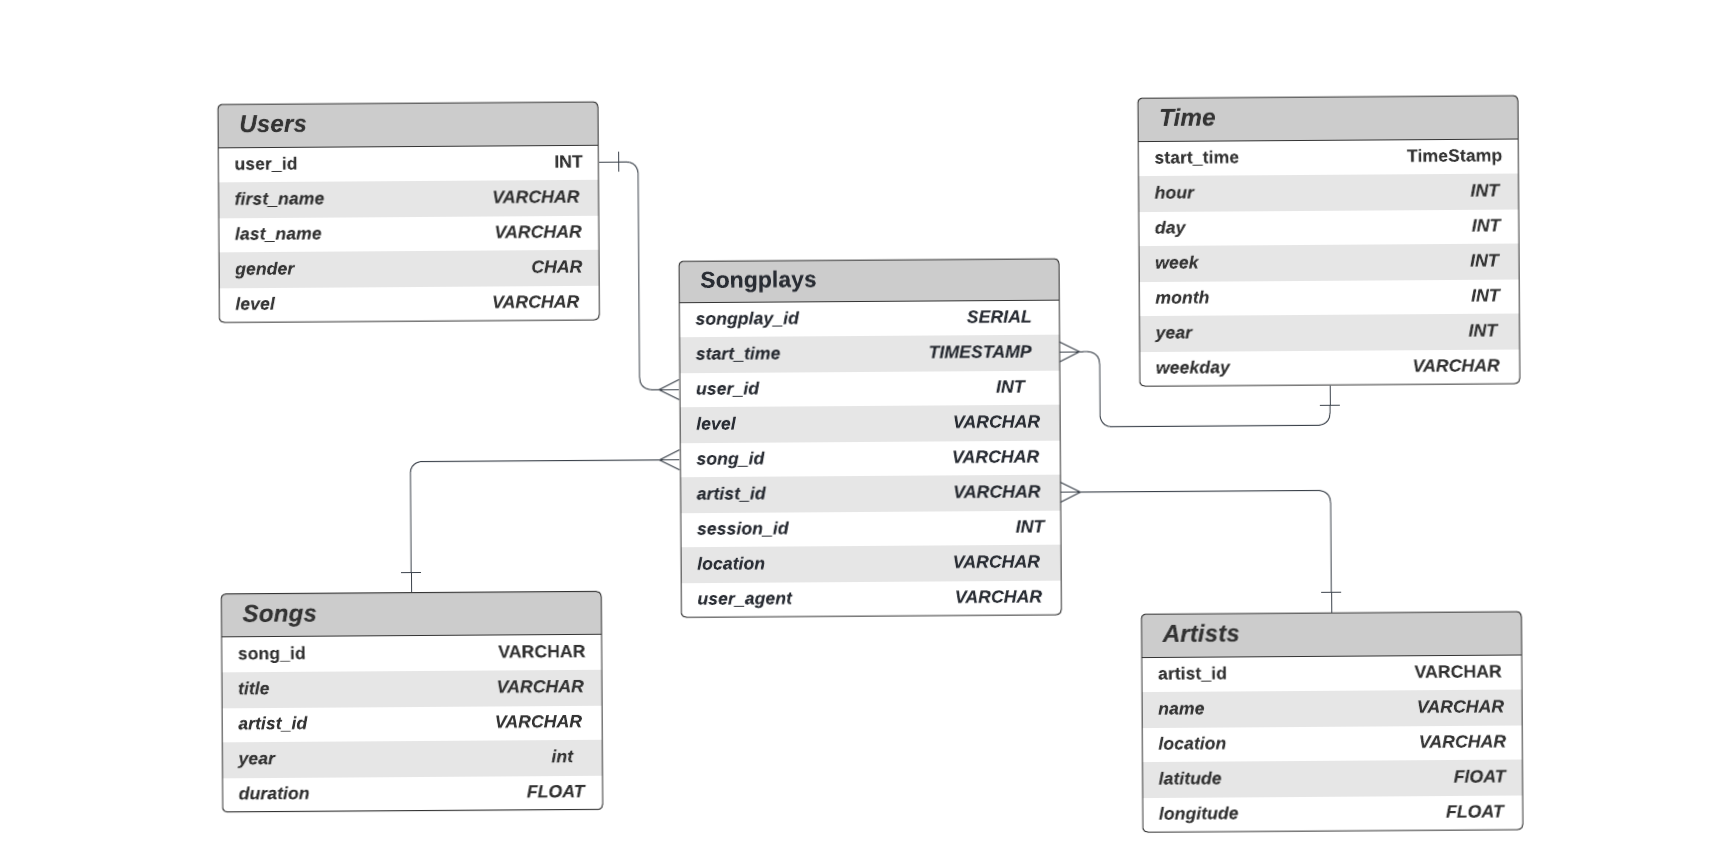
The schema used for this exercise is the Star Schema:
There is one main fact table containing all the measures associated to each event (user song plays),
and 4 dimentional tables, each with a primary key that is being referenced from the fact table.
songplays
    songplay_id SERIAL PRIMARY KEY,
    start_time  TIMESTAMP NOT NULL,
    user_id     INT NOT NULL,
    level       VARCHAR NOT NULL,
    song_id     VARCHAR,
    artist_id   VARCHAR,
    session_id  INT NOT NULL,
    location    VARCHAR NOT NULL,
    user_agent  VARCHAR NOT NULL
users
    user_id    INT PRIMARY KEY,
    first_name VARCHAR NOT NULL,
    last_name  VARCHAR NOT NULL,
    gender     CHAR NOT NULL,
    level      VARCHAR NOT NULL
songs
    song_id   VARCHAR PRIMARY KEY,
    title     VARCHAR NOT NULL,
    artist_id VARCHAR NOT NULL,
    year      INT NOT NULL,
    duration  FLOAT NOT NULL
artists
    artist_id VARCHAR PRIMARY KEY,
    name      VARCHAR NOT NULL,
    location  VARCHAR NOT NULL,
    latitude  FLOAT,
    longitude FLOAT
time
    start_time TIMESTAMP PRIMARY KEY,
    hour       INT NOT NULL,
    day        INT NOT NULL,
    week       INT NOT NULL,
    month      INT NOT NULL,
    year       INT NOT NULL,
    weekday    VARCHAR NOT NULL
Files used on the project:
- data folder contain all json datasets file
- sql_queries.py contains all sql queries, and is imported into the files bellow.
- create_tables.py drops and creates tables. You run this file to reset your tables before each time you run your ETL scripts.
- test.ipynb displays the first few rows of each table to let you check your database.
- etl.ipynb reads and processes a single file from song_data and log_data and loads the data into your tables.
- etl.py reads and processes files from song_data and log_data and loads them into your tables.
- README.md current file, provides discussion on my project.
1 - Update Database Name ,User and Password in create_tables.py,test.ipynb,etl.ipynb
2 - Wrote DROP, CREATE and INSERT query statements in sql_queries.py
3 - Run in Terminal
python create_tables.py
4 - Used test.ipynb Jupyter Notebook to interactively verify that all tables were created correctly.
5 - Followed the instructions and completed etl.ipynb Notebook to create the blueprint of the pipeline to process and insert all data into the tables.
6 - Once verified that base steps were correct by checking with test.ipynb, filled in etl.py program.
7 - Run etl in console:
python etl.py
8 - Run test.ipynb , to show data.