Home
DigitalRCS-TimeOverlay-Panel is a datasource-neutral Grafana panel visualization that combines Grafana-compatible time-series rendering with persistent duration selections and movable notes. It can visualize any compatible time-series measurements; no datasource, series name, or business domain is hardcoded. Overlays are stored with the dashboard and remain visible in supported PNG and PDF rendering.
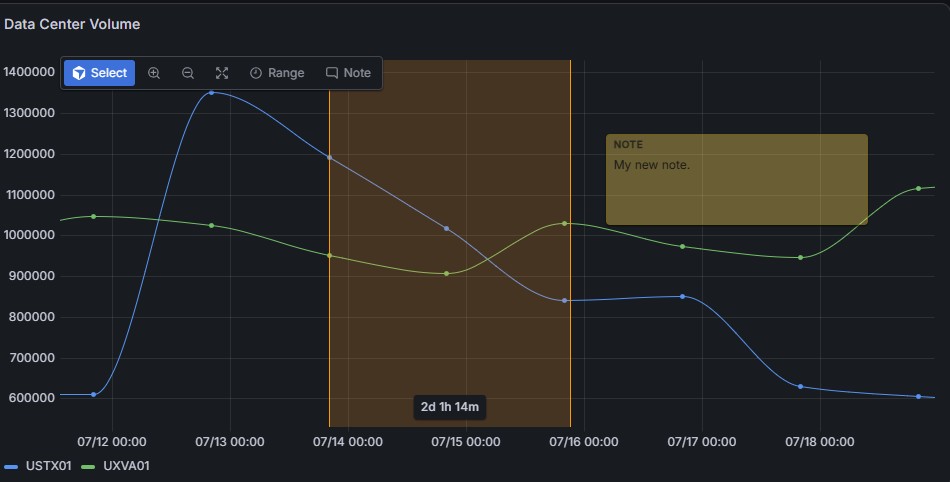
- User guide - Add the panel, navigate the timeline, create ranges, and add notes.
- Data sources - Required Grafana data shapes, CSV, Splunk, SQL, and dynamic series.
- Panel configuration - Colors, opacity, points, line style, legend, and toolbar settings.
- Deployment - Prebuilt installation and production deployment guidance.
- Developer guide - Architecture, local development, tests, packaging, and releases.
- Troubleshooting - Common installation, data, display, save, and export problems.
- Grafana 12.3.0 or later.
- Self-hosted Grafana and Grafana Enterprise support unsigned installation when the plugin ID is explicitly allowed.
- Grafana Cloud requires a catalog-published plugin; it does not support the unsigned installation path.
- Any normal Grafana datasource can be used when its result includes a typed time field and one or more numeric fields.