When my code hits a StackOverflowException and I try to debug it, instead of seeing a stack-trace of user-code or .NET library code (Framework Source Stepping is enabled), I find myself in an assembly window with a large list of stack points in the Call Stack window, with none of the entries leading to user code:
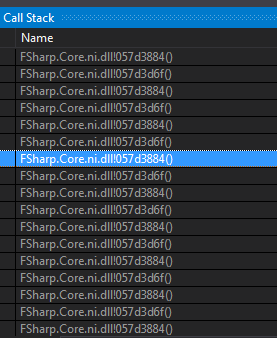
Oh, and it took VS about 10 minutes to build up the breakpoint and show the disassembly, until that time it froze. I run a debug build (see also settings below). With a "normal" SO, it is almost immediate.
Repro steps
When I try to repro this with a non-tailrecursive function in the same project, I just get into the normal debugging experience with the compiler pointing at the proper location.
Expected behavior
Should get a debugging experience where the debugger knows the correct location. Should not see FSharp.Core.ni.dll in the the call stack.
Related information
I am seeing this with a project that still has FSharp.Core 4.0.0.1 linked. However I doubt that lies at the root of this.
I'm not sure this is a bug, I'm merely curious what kind of code could hit this. Perhaps inlined recursive code (I don't think that's even possible, I would get a "is not bound to an optimization environment" error) or normal recursive code that uses inlines? But when I try to repro an SO with that, the debugger usually points me at the nearest call-site that isn't inlined.
Is this "expected behavior"? If so, perhaps we can improve the experience here? Should the debugger link to the *.ni.dll files? In my opinion, it shouldn't.
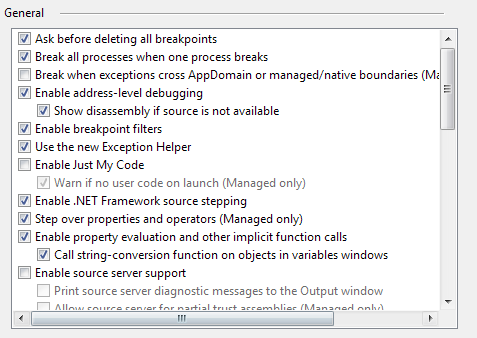

When my code hits a StackOverflowException and I try to debug it, instead of seeing a stack-trace of user-code or .NET library code (Framework Source Stepping is enabled), I find myself in an assembly window with a large list of stack points in the Call Stack window, with none of the entries leading to user code:
Oh, and it took VS about 10 minutes to build up the breakpoint and show the disassembly, until that time it froze. I run a debug build (see also settings below). With a "normal" SO, it is almost immediate.
Repro steps
When I try to repro this with a non-tailrecursive function in the same project, I just get into the normal debugging experience with the compiler pointing at the proper location.
Expected behavior
Should get a debugging experience where the debugger knows the correct location. Should not see FSharp.Core.ni.dll in the the call stack.
Related information
I am seeing this with a project that still has FSharp.Core 4.0.0.1 linked. However I doubt that lies at the root of this.
I'm not sure this is a bug, I'm merely curious what kind of code could hit this. Perhaps inlined recursive code (I don't think that's even possible, I would get a "is not bound to an optimization environment" error) or normal recursive code that uses inlines? But when I try to repro an SO with that, the debugger usually points me at the nearest call-site that isn't inlined.
Is this "expected behavior"? If so, perhaps we can improve the experience here? Should the debugger link to the *.ni.dll files? In my opinion, it shouldn't.