Repository navigation
Outputs
-o/--html_outfile writes one self-contained file. Every plot and the plotly runtime
are embedded, so it opens offline and can be emailed as-is. Expect a few MB; a run with
many barcodes can reach tens of MB.
Plots are interactive: hover for values, drag to zoom, double-click to reset, and use
the legend to toggle series. Most plots carry All / Pass / Fail buttons to switch
between read sets, where pass means at or above --min_pass_qual and at least
--min_pass_len.
Which plots appear depends on the columns available. Alignment plots need -a, barcode
plots need barcode information, and %GC plots need a summary built from FASTQ or BAM.

Summary tables
| Plot | Shows |
|---|---|
run_summary |
Run identifiers, read and base counts, run duration |
basecall_summary |
Reads, bases, median length, N50, median quality |
basecall_summary_per_barcode |
The same, per barcode |
alignment_summary |
Alignment counts and rates (needs -a) |
signal_summary |
Reads, median time in pore, total pore time, active channels (raw signal runs) |
Distributions
| Plot | Shows |
|---|---|
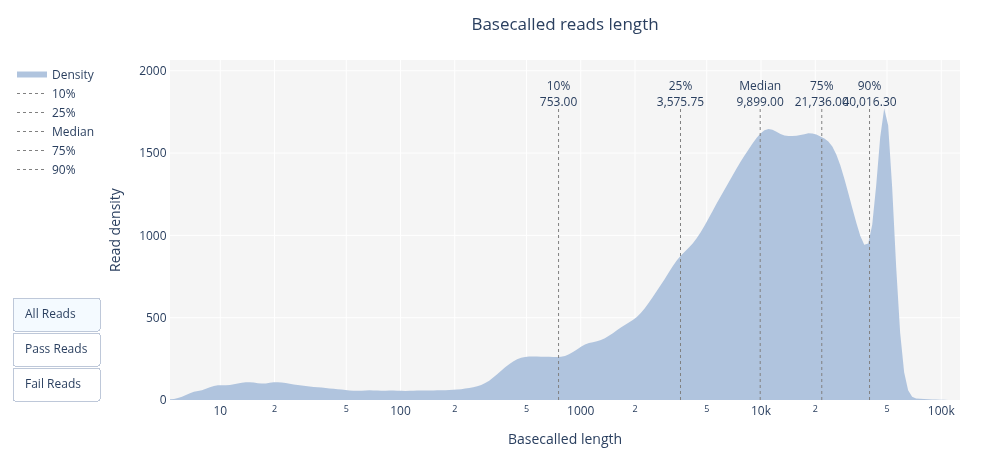
read_len_1D |
Basecalled read length |
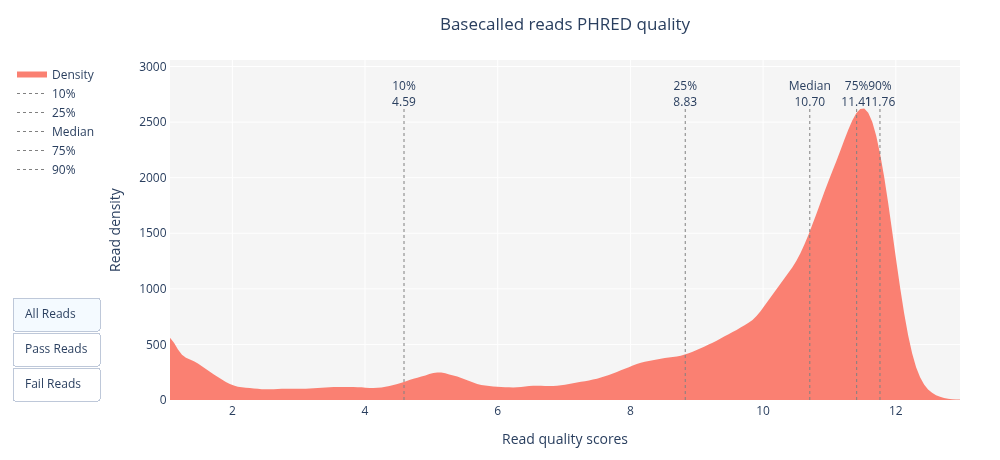
read_qual_1D |
Mean PHRED quality per read |
align_len_1D |
Aligned read length |
identity_freq_1D |
Alignment identity |
length_boxplot_per_barcode |
Read length per barcode |
gc_boxplot_per_barcode |
%GC per barcode |
read_duration_1D |
How long each read held its pore (raw signal runs) |
Two-dimensional
| Plot | Shows |
|---|---|
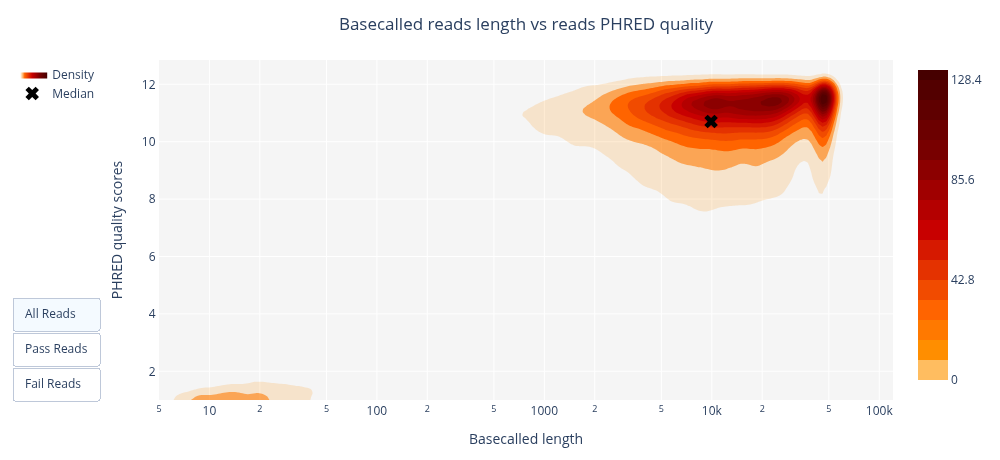
read_len_read_qual_2D |
Length against quality |
read_len_read_gc_2D |
Length against %GC |
read_len_align_len_2D |
Basecalled against aligned length |
align_len_identity_freq_2D |
Aligned length against identity |
read_qual_identity_freq_2D |
Quality against identity |
Over run time
| Plot | Shows |
|---|---|
output_over_time |
Cumulative reads and bases |
read_len_over_time |
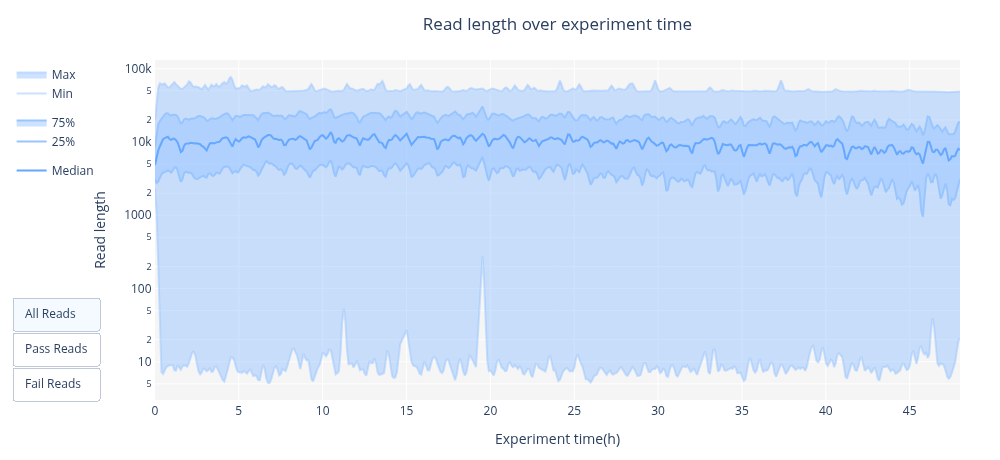
Median length and quartiles over time |
read_qual_over_time |
Median quality and quartiles over time |
read_gc_over_time |
%GC over time |
align_len_over_time |
Aligned length over time |
identity_freq_over_time |
Identity over time |
read_duration_over_time |
Time in pore over experiment time (raw signal runs) |
channels_activity |
Per-channel activity heatmap |
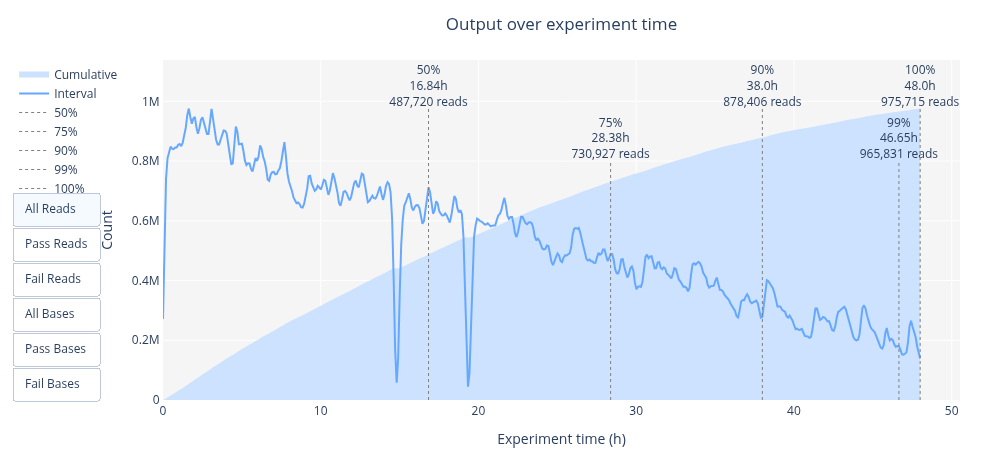
Cumulative output flattening out as the run goes on, with the interval trace falling away beneath it. The two sharp dips are pauses in this run. A cumulative curve that goes flat early means the flow cell stopped producing.
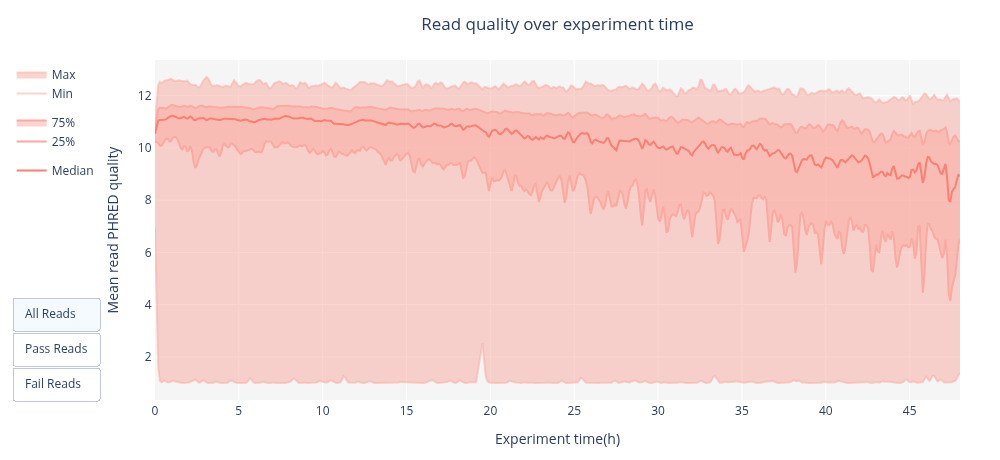
Median quality drifting down over 48 hours with the spread widening, the usual signature of pores degrading.
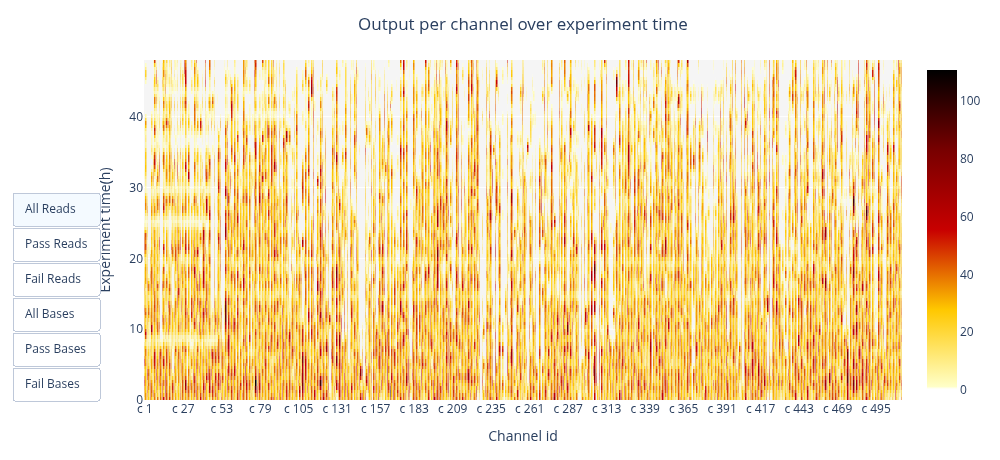
Output per channel across 48 hours. Coverage is dense early and thins towards the top of the plot as pores die, which is the normal shape; a band going quiet early, or a block of channels never firing, is worth looking into.
Barcodes and alignment
| Plot | Shows |
|---|---|
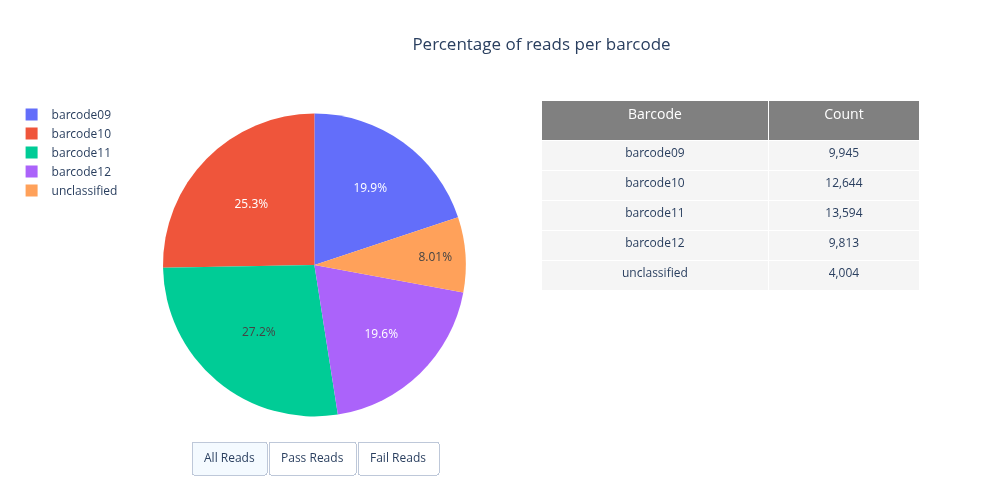
barcode_counts |
Reads per barcode |
alignment_reads_status |
Aligned, unaligned and secondary counts |
alignment_rate |
Fraction of bases aligned |
alignment_coverage |
Coverage along the reference |
A falling read_qual_over_time, or channels_activity thinning out partway through,
usually points at pore exhaustion rather than anything wrong with the library.
All example figures come from a 48 hour lambda phage run on a MinION, 975,715 reads, the EPI2ME Labs basic QC tutorial dataset.
-p/--pdf_outfile writes the same plots as static images, one per page. The HTML
report embeds the plotly runtime and every data point, so it runs to several megabytes;
the PDF of the same run is usually twenty times smaller, which makes it practical to
email or paste into a lab notebook. The trade is the interactivity.
pycoQC -f sequencing_summary.txt -o report.html -p report.pdfRendering needs a headless browser through kaleido, which is an optional extra:
pip install 'pycoqc-ng[pdf]'The PDF honours the same configuration as the HTML report, so trimming the plot list
trims the PDF. An example built from the bundled test data is in the repository at
docs/examples/pycoQC_report_example.pdf
(around 480 KB, against roughly twenty times that for the same report as HTML).
-j/--json_outfile writes the same statistics in machine-readable form, for pipelines
and MultiQC-style aggregation. Computed on all reads, not the plotting sample.
{
  "pycoqc": { "version": "3.1.0", "date": "20/10/26" },
  "All Reads": {
    "run": { ... },
    "basecall": {
      "reads_number": 3999,
      "bases_number": 5690011,
      "N50": 1959,
      ...
    }
  },
  "Pass Reads": { ... }
}
Top-level keys are pycoqc, All Reads and Pass Reads; an alignment section is
added under each when -a is given. On a run that has not been basecalled there is no
basecall section, because there is no sequence to describe; a signal section takes
its place, holding reads_number and, where the summary carries durations,
median_duration, total_duration, duration_percentiles and duration_hist.
Missing statistics are written as null, so the file is valid JSON for jq, R and
JavaScript as well as Python. Reading a couple of fields:
import json

with open("pycoQC_report.json") as fh:
    report = json.load(fh)

stats = report["All Reads"]
if "basecall" in stats:
    print(stats["basecall"]["reads_number"], stats["basecall"]["N50"])
else:                                   # a run that was never basecalled
print(stats["signal"]["reads_number"])The length at which half the sequenced bases sit in reads of that length or longer.
Computed over every read, not the sample, so it is stable across --sample settings.
One sequencing_summary_<barcode>.txt per barcode in the output directory. Barcode
columns are dropped, since the filename carries that information. Unclassified reads
are skipped unless -u is given, and barcodes below -p are skipped too. Each file is
a valid summary, so it can be fed straight back into pycoQC:
Barcode_split -f sequencing_summary.txt -o split/
pycoQC -f split/sequencing_summary_barcode01.txt -o barcode01.html