Repository navigation
Home

Interactive quality-control metrics and plots for Oxford Nanopore sequencing runs.
pycoqc-ng reads the sequencing_summary.txt file that the basecaller writes and
produces a single self-contained HTML report, optionally alongside a machine-readable
JSON summary. If you have no summary file, it can build one from FASTQ, unaligned BAM
(Dorado), POD5 or legacy FAST5.
This is a maintained continuation of pycoQC by Adrien Leger and Tommaso Leonardi, which is no longer developed. The method and the original implementation are theirs; please see citing.
conda create -n pycoqc-ng -c conda-forge -c bioconda pycoqc-ng
conda activate pycoqc-ng

pycoQC -f sequencing_summary.txt -o pycoQC_report.html
Or with pip:
pip install pycoqc-ng
pycoQC -f sequencing_summary.txt -o pycoQC_report.html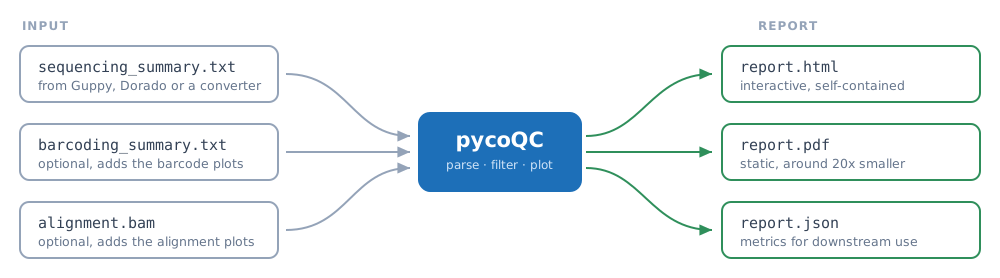
Only the basecaller's sequencing summary is required. A barcoding summary unlocks the per-barcode plots and a BAM unlocks the alignment plots; both are optional.
The HTML report is a single file you can open in any browser and send to a collaborator, with every plot embedded so there are no external assets to keep alongside it. The PDF is the same plots rendered statically, around twenty times smaller, for when a few hundred kilobytes matters more than interactivity. The JSON carries the same statistics for a pipeline to read.
Reads are split into pass and fail on quality (and optionally length), and most plots can be viewed for either set. See Outputs for the full plot catalogue.
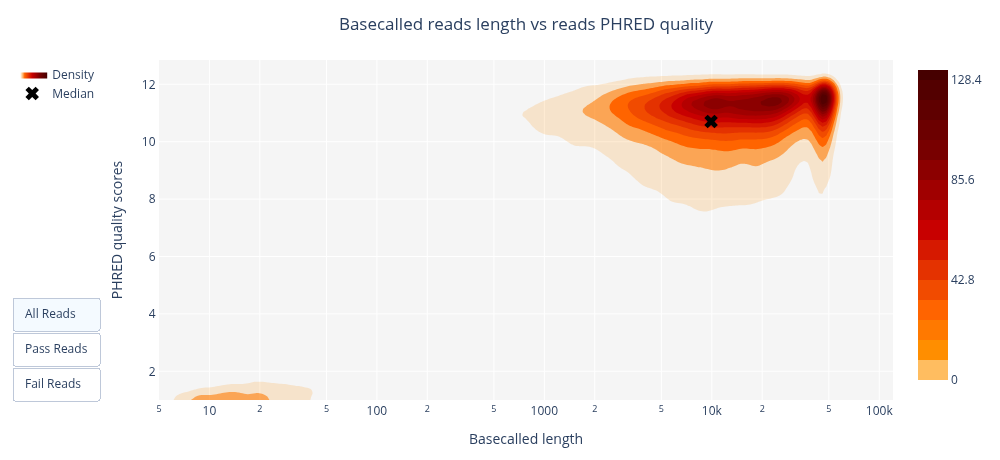
Read length against quality for a 48 hour lambda phage run. In the report this is interactive: hover for values, drag to zoom, and switch between all, pass and fail reads.
| Page | What it covers |
|---|---|
| Installation | conda, pip, from source, development setup |
| Usage | every command-line option, and the Python API |
| Input formats | summary files, and building one from FASTQ/BAM/POD5/FAST5 |
| Outputs | the HTML report, the JSON schema, and what each plot shows |
| Configuration | choosing and tuning the plots |
| FAQ | common errors and questions |
| Development | tests, CI, and how releases are cut |
If you use this tool, please cite the original paper:
Leger A. and Leonardi T. (2019). pycoQC, interactive quality control for Oxford Nanopore Sequencing. Journal of Open Source Software, 4(34), 1236. https://doi.org/10.21105/joss.01236
To reference a specific software version, the Zenodo concept DOI 10.5281/zenodo.23484147 always resolves to the latest release.
GPLv3, unchanged from the original project.