A Colorado Board of Election employee working for a local congressional election. Has commissioned us with a set of tasks, to complete an election audit.
- The total number of votes that were cast.
- A complete list of candidates who happen to receive votes.
- The percent of each votes that the three candidates won.
- The total number of votes that each of the three candidates won.
- The winner of the election based on popular vote.
- The turnout of each voter per county
- The percent of votes for each county out of the total count.
- The county that had the highest turn around.
-Software: Python 3.7, and Visual Studio Code, 1.66
-Data source: election_reslults.csv provided by the Colorado Board of Election Employee.
The analysis of the election show that:
-
There were a total of 369,711 votes
-
There were three candidates:
- Charles Casper Stockham
- Diana DeGette:
- Raymon Anthony Doane
-
The candidates results were:
- Charles C. Stockham received 23% of the vote, and 85,213 total number of votes.
- Diana DeGette received 73.8% of the vote, and 272,892 total number of votes.
- Raymon A. Doane: received 3.1% of the vote, and 11,606 total number of votes.
-
The election winner was:
- Candidate 3, Diana DeGette, who received 73.8% of the vote and 272,892 total number of votes.
-
The turnout of each voter per county:
- Jefferson County with 38,855 votes
- Denver County with 306,055 votes
- Arapahoe County with 24,801 votes
-
The percent of votes for each county out of the total count.
- Jefferson County had 10.5% of the votes.
- Denver County had 82.8% of the votes.
- Arapahoe County had 6.7% of the votes.
-
The county that had the highest turn around was:
- Denver, CO
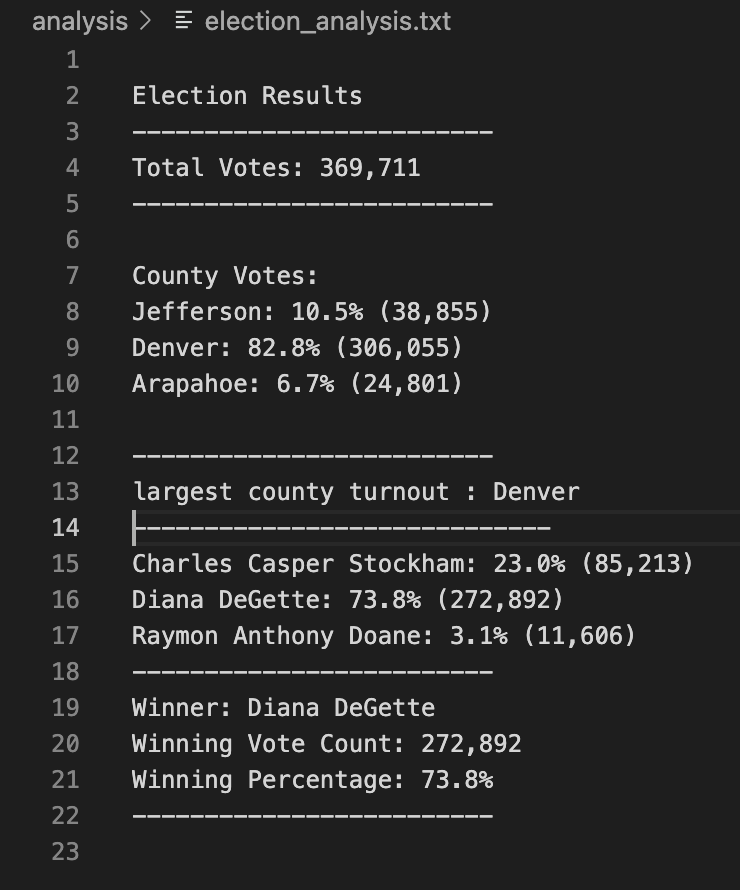
*summary image of relsuts of the election_analysis.txt
As the election comes to a close, and we congratulate the winner. What was asked of us in the audit allowed us to give clear and cohesive results. It's just one of the many benefits that our services allows us to do. The script that we used maybe simple, yet, it’s mighty. It can be manipulated in many ways, that can be beneficial for future election performances. Those include broadening or narrowing the parameters of the election results. Which could cover each candidate's financial statistics. To show how each one managed their budget, and how that translated into the votes they received. Another parameter could be, the type of demographic that each candidate was targeting, and how that swayed or altered their votes received.
These are just a few examples, as stated before, there are so many possibilities that can be provided. Knowledge is a powerful thing, and the data is here to help. Who’s to say that whoever you are representing in the future, might want to take it past the local level... A few changes here, and there to the script could be an advantage.
Ultimately, we are here to help. Please let us know if you need any further assistance, and we would be more than happy to consult, and figure out what best suits your needs.