

![]()
DevTools for AI calls. One line of setup and a local dashboard shows every LLM call your app makes: the prompt, what it cost, how many tokens, how long it took, and which tools it called. Runs on your machine. No signup.
Think of it as the browser Network tab, pointed at your AI calls.
When you build something on top of an LLM you mostly fly blind. You send a prompt, you get an answer, and the interesting parts are invisible: the exact text that went to the model after your code stitched it together, the dollar cost of that one call, whether the agent called a tool and how long it took, and whether a prompt or model swap quietly made things worse.
The tools that answer this (Langfuse, Arize Phoenix, Helicone) are platforms you deploy. Seerlens is the opposite: a single command you run locally while you build.
- Live trace feed. Calls show up the moment they happen.
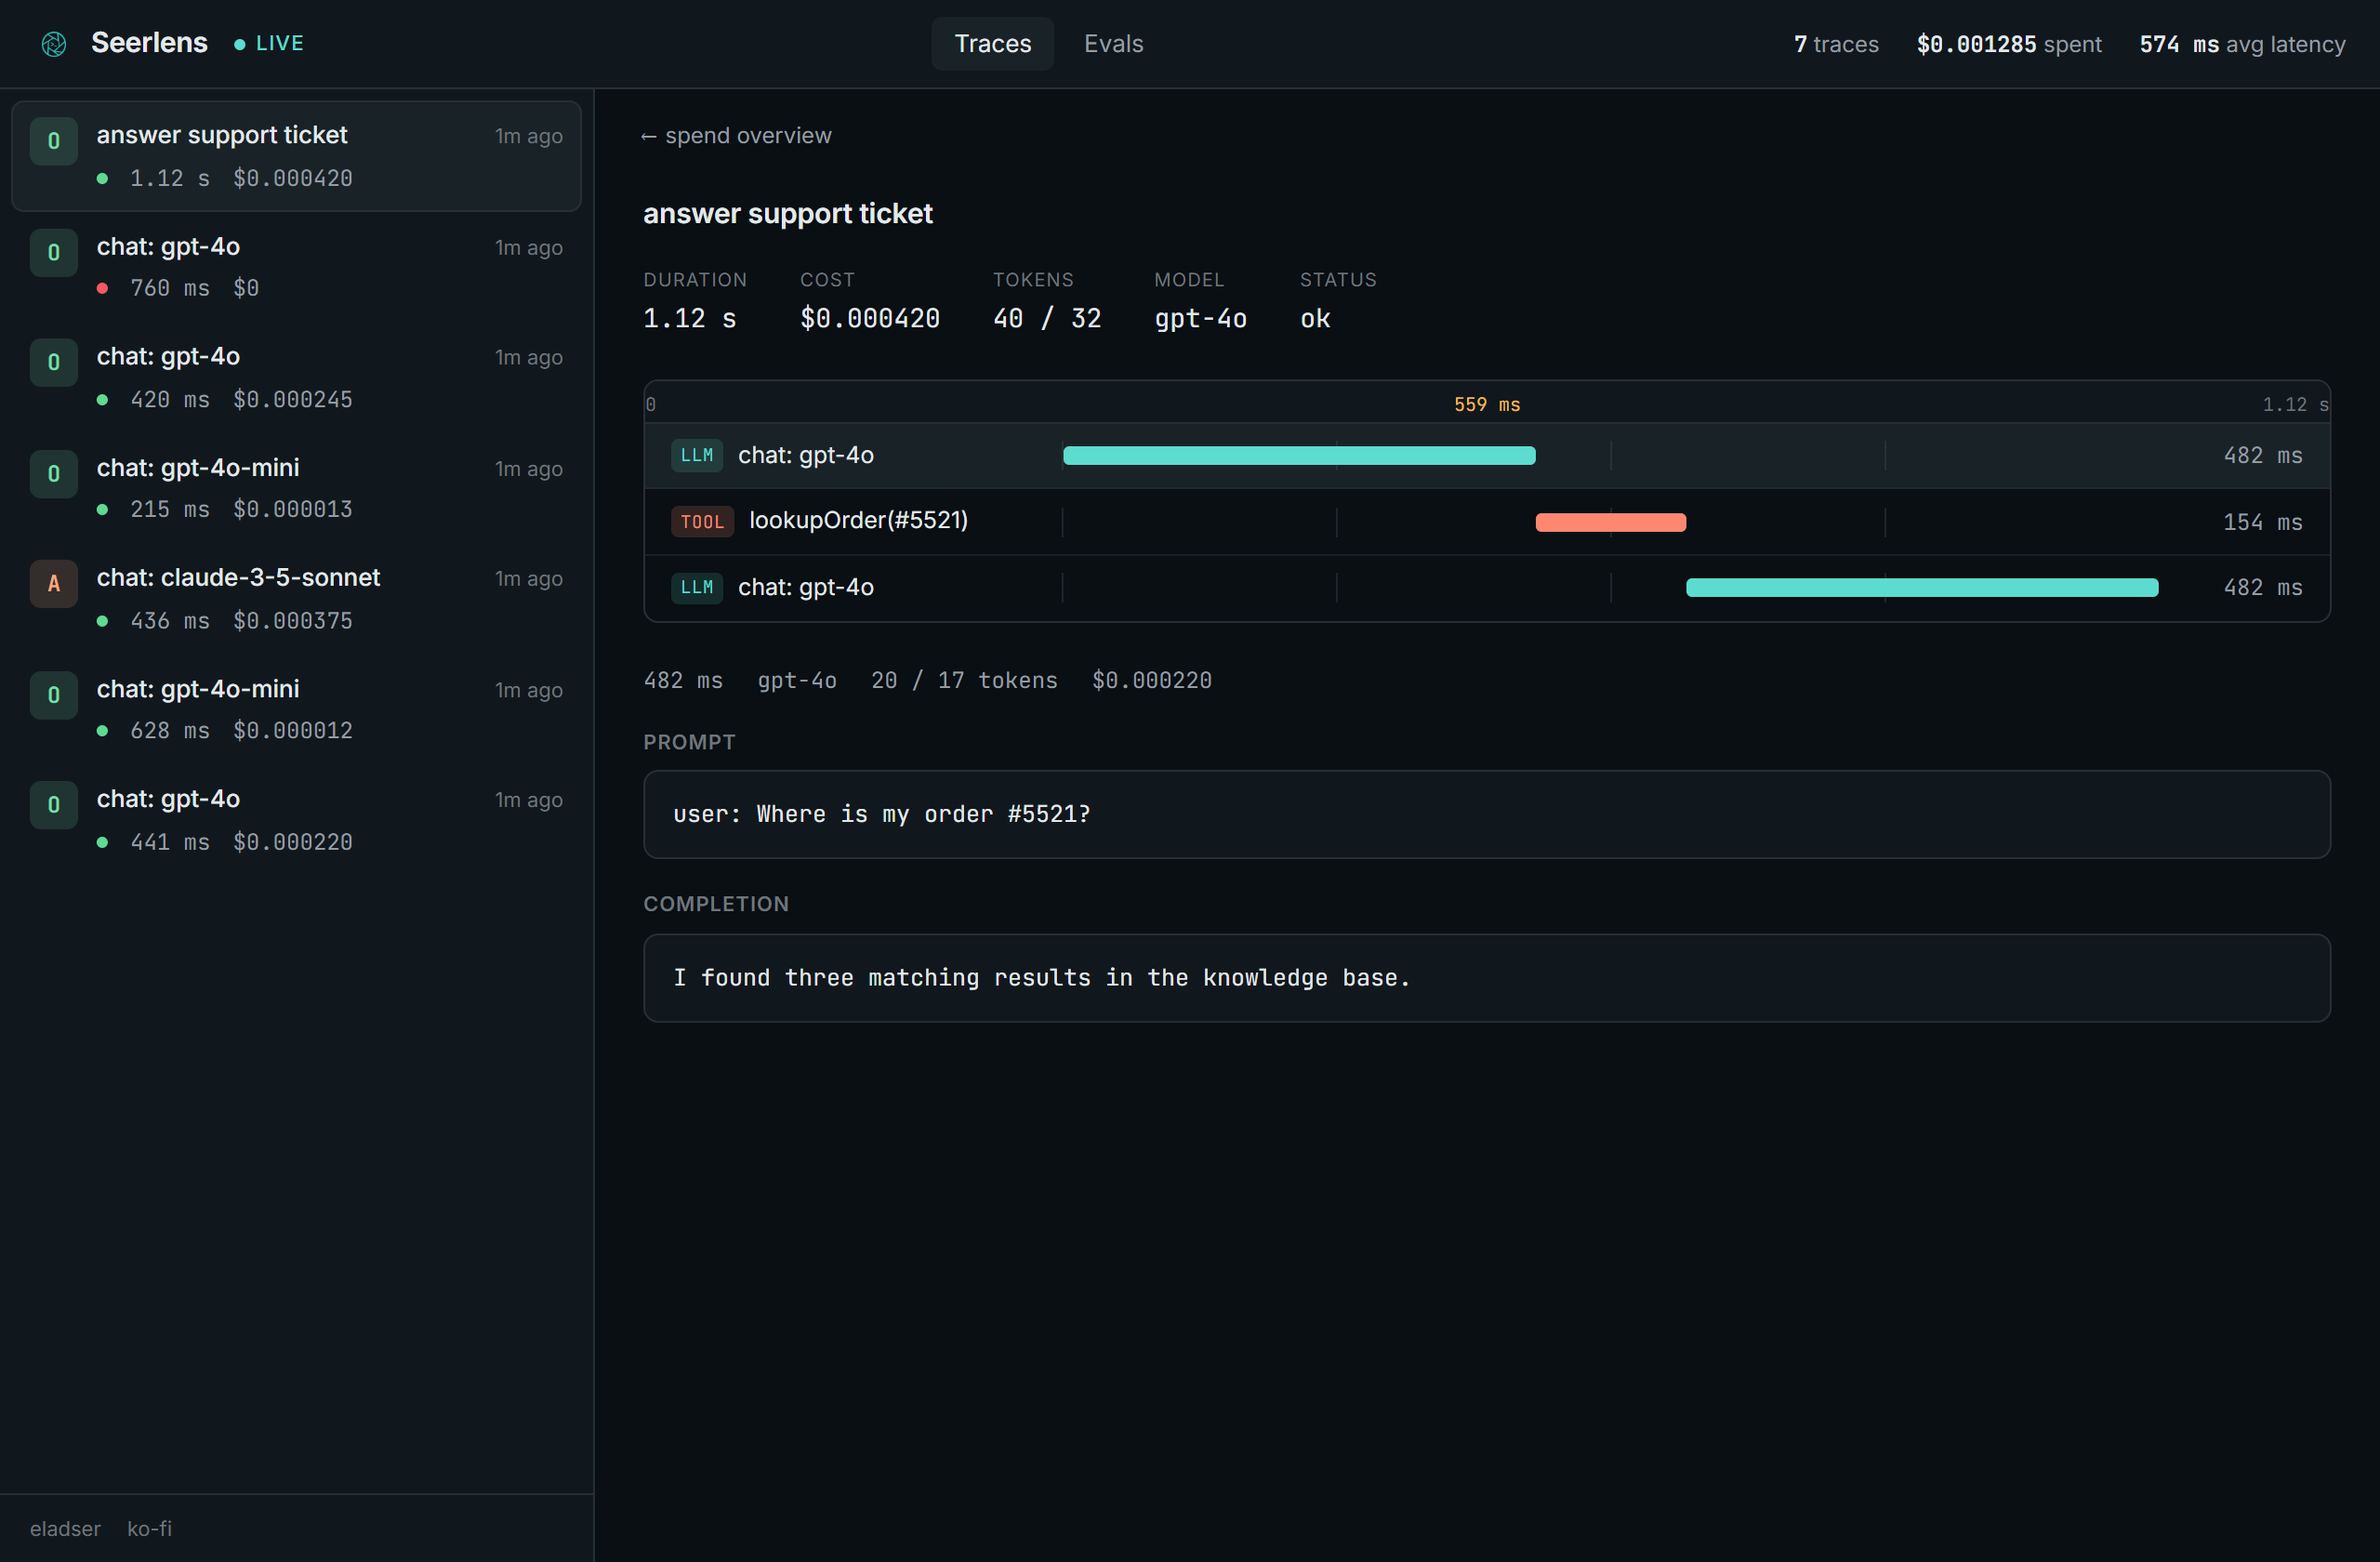
- A timeline per trace. LLM calls and tool calls laid out on a real time ruler, so you can see what ran when and what was slow.
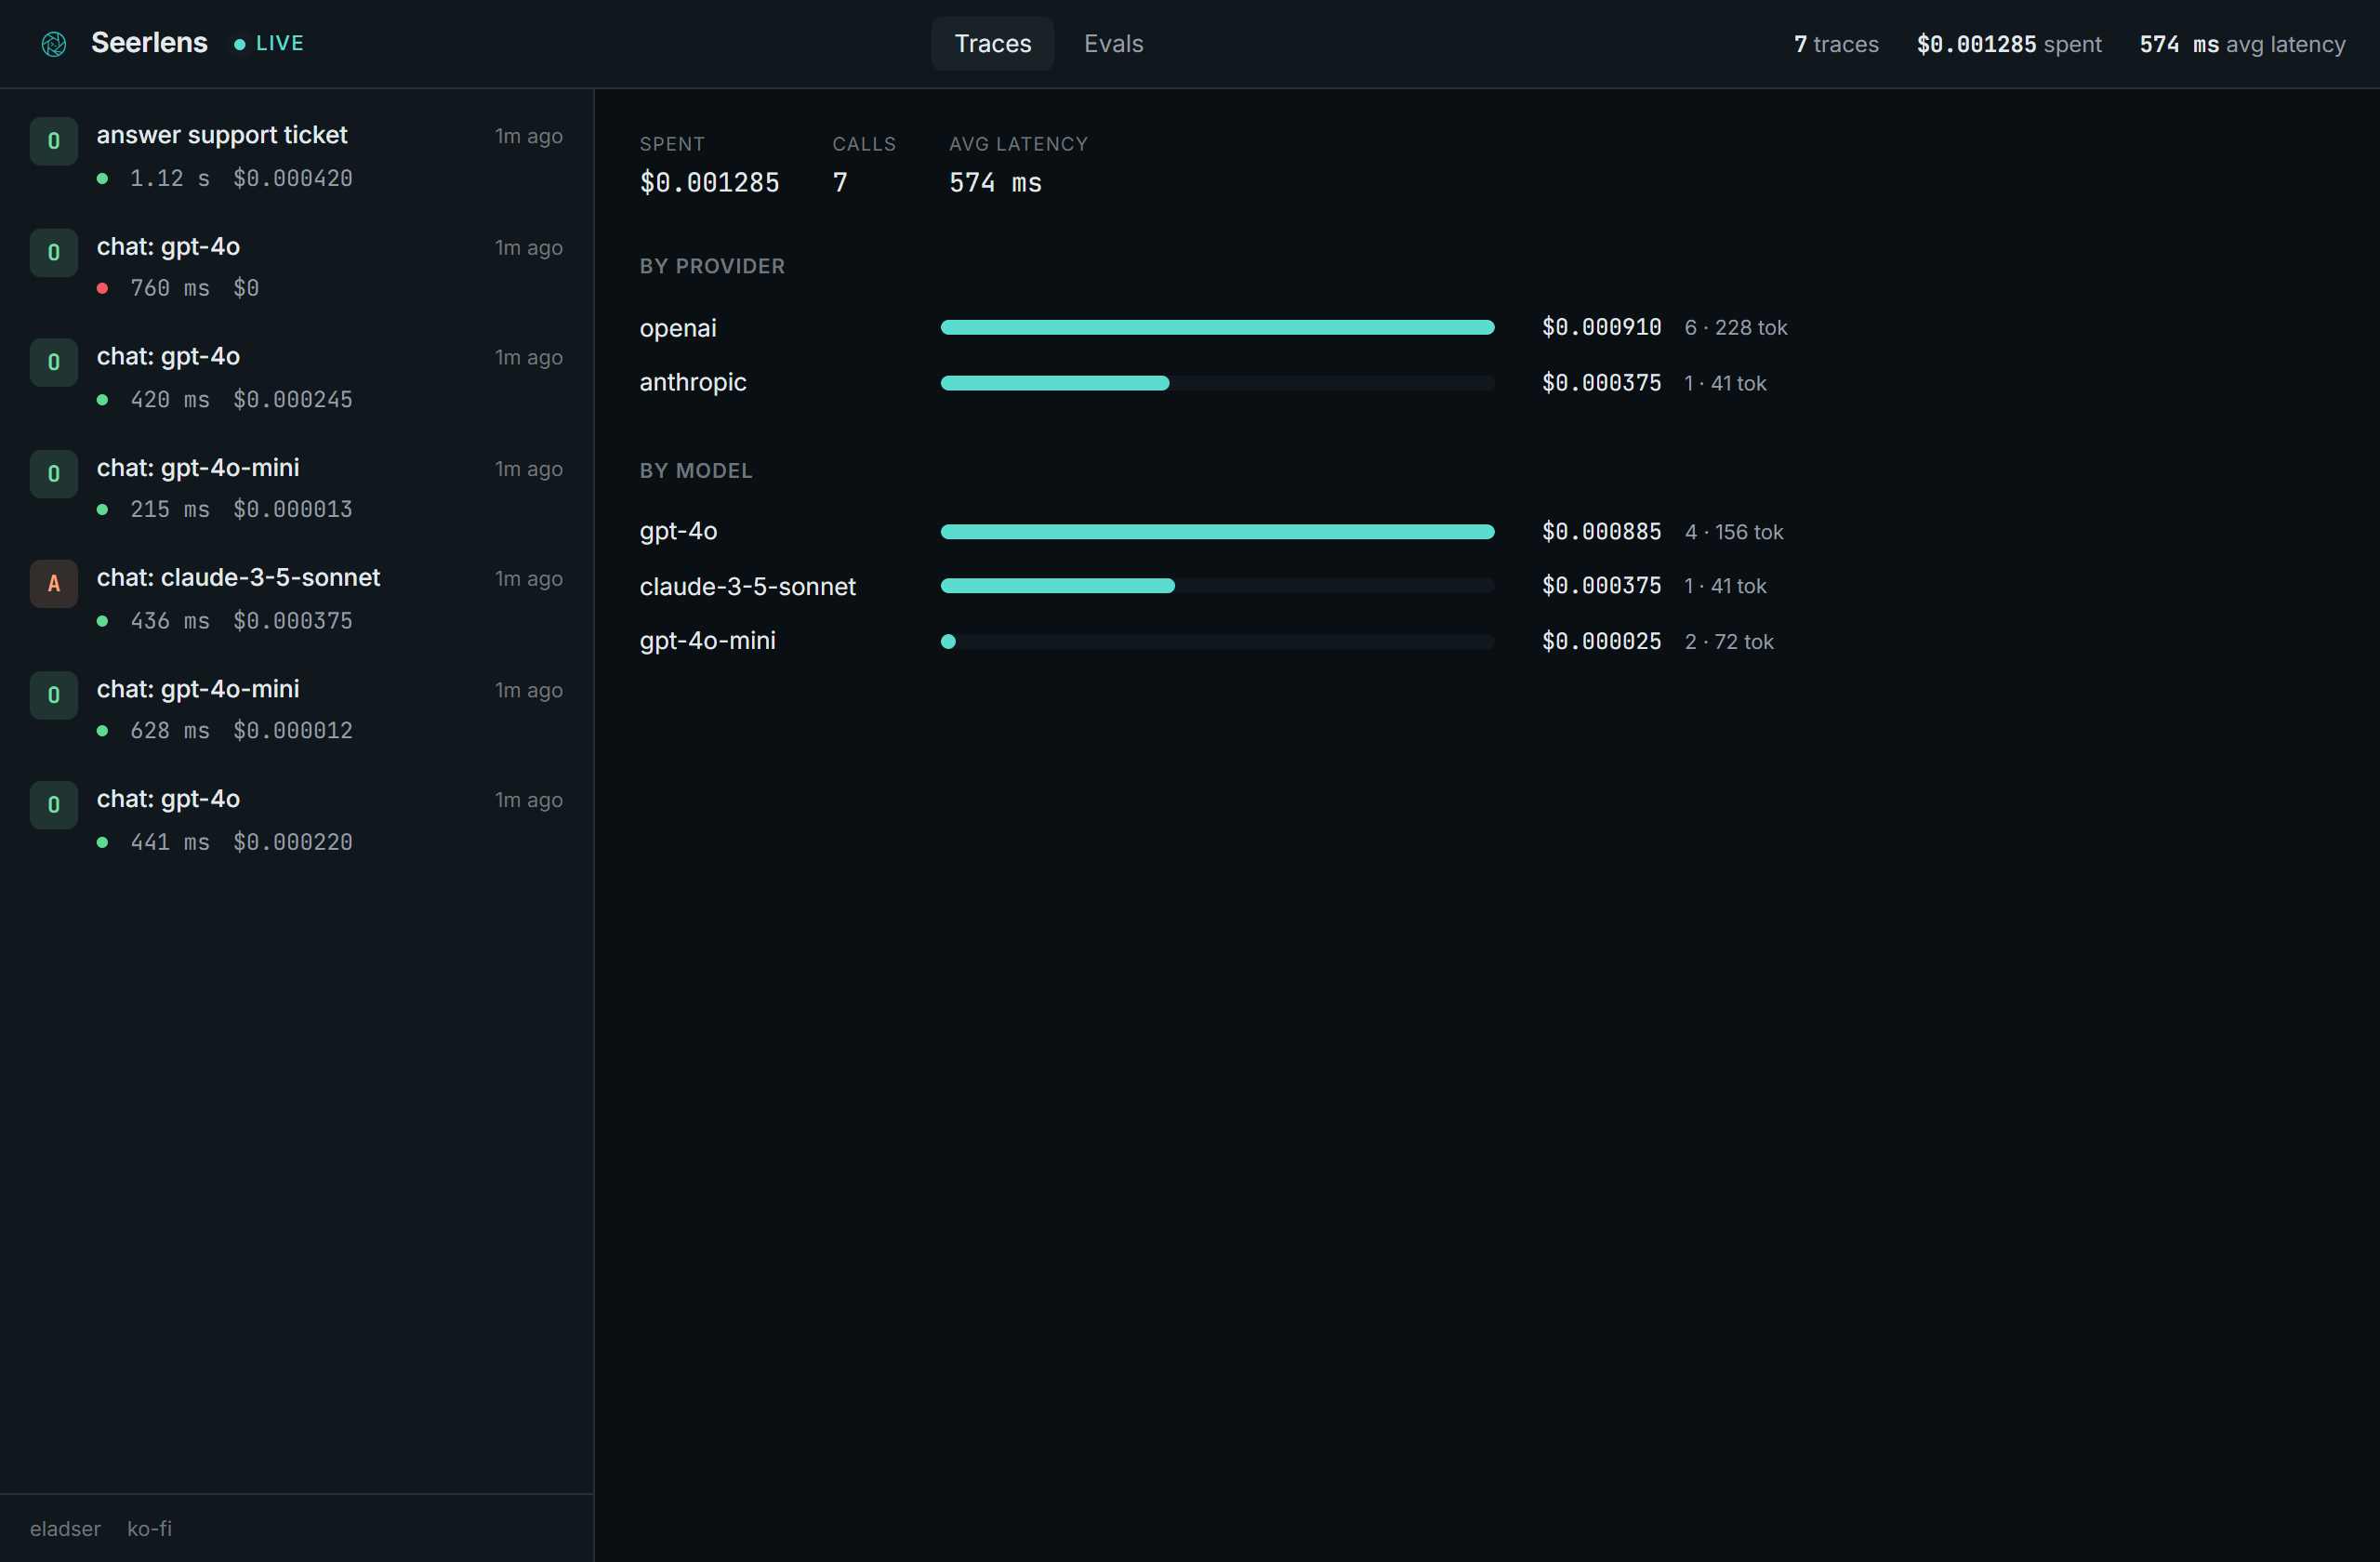
- Cost, tokens, latency per call and per trace, plus a spend breakdown by provider and model, priced across the common OpenAI, Anthropic, and Google models.
- The actual prompt and completion, not a summary.
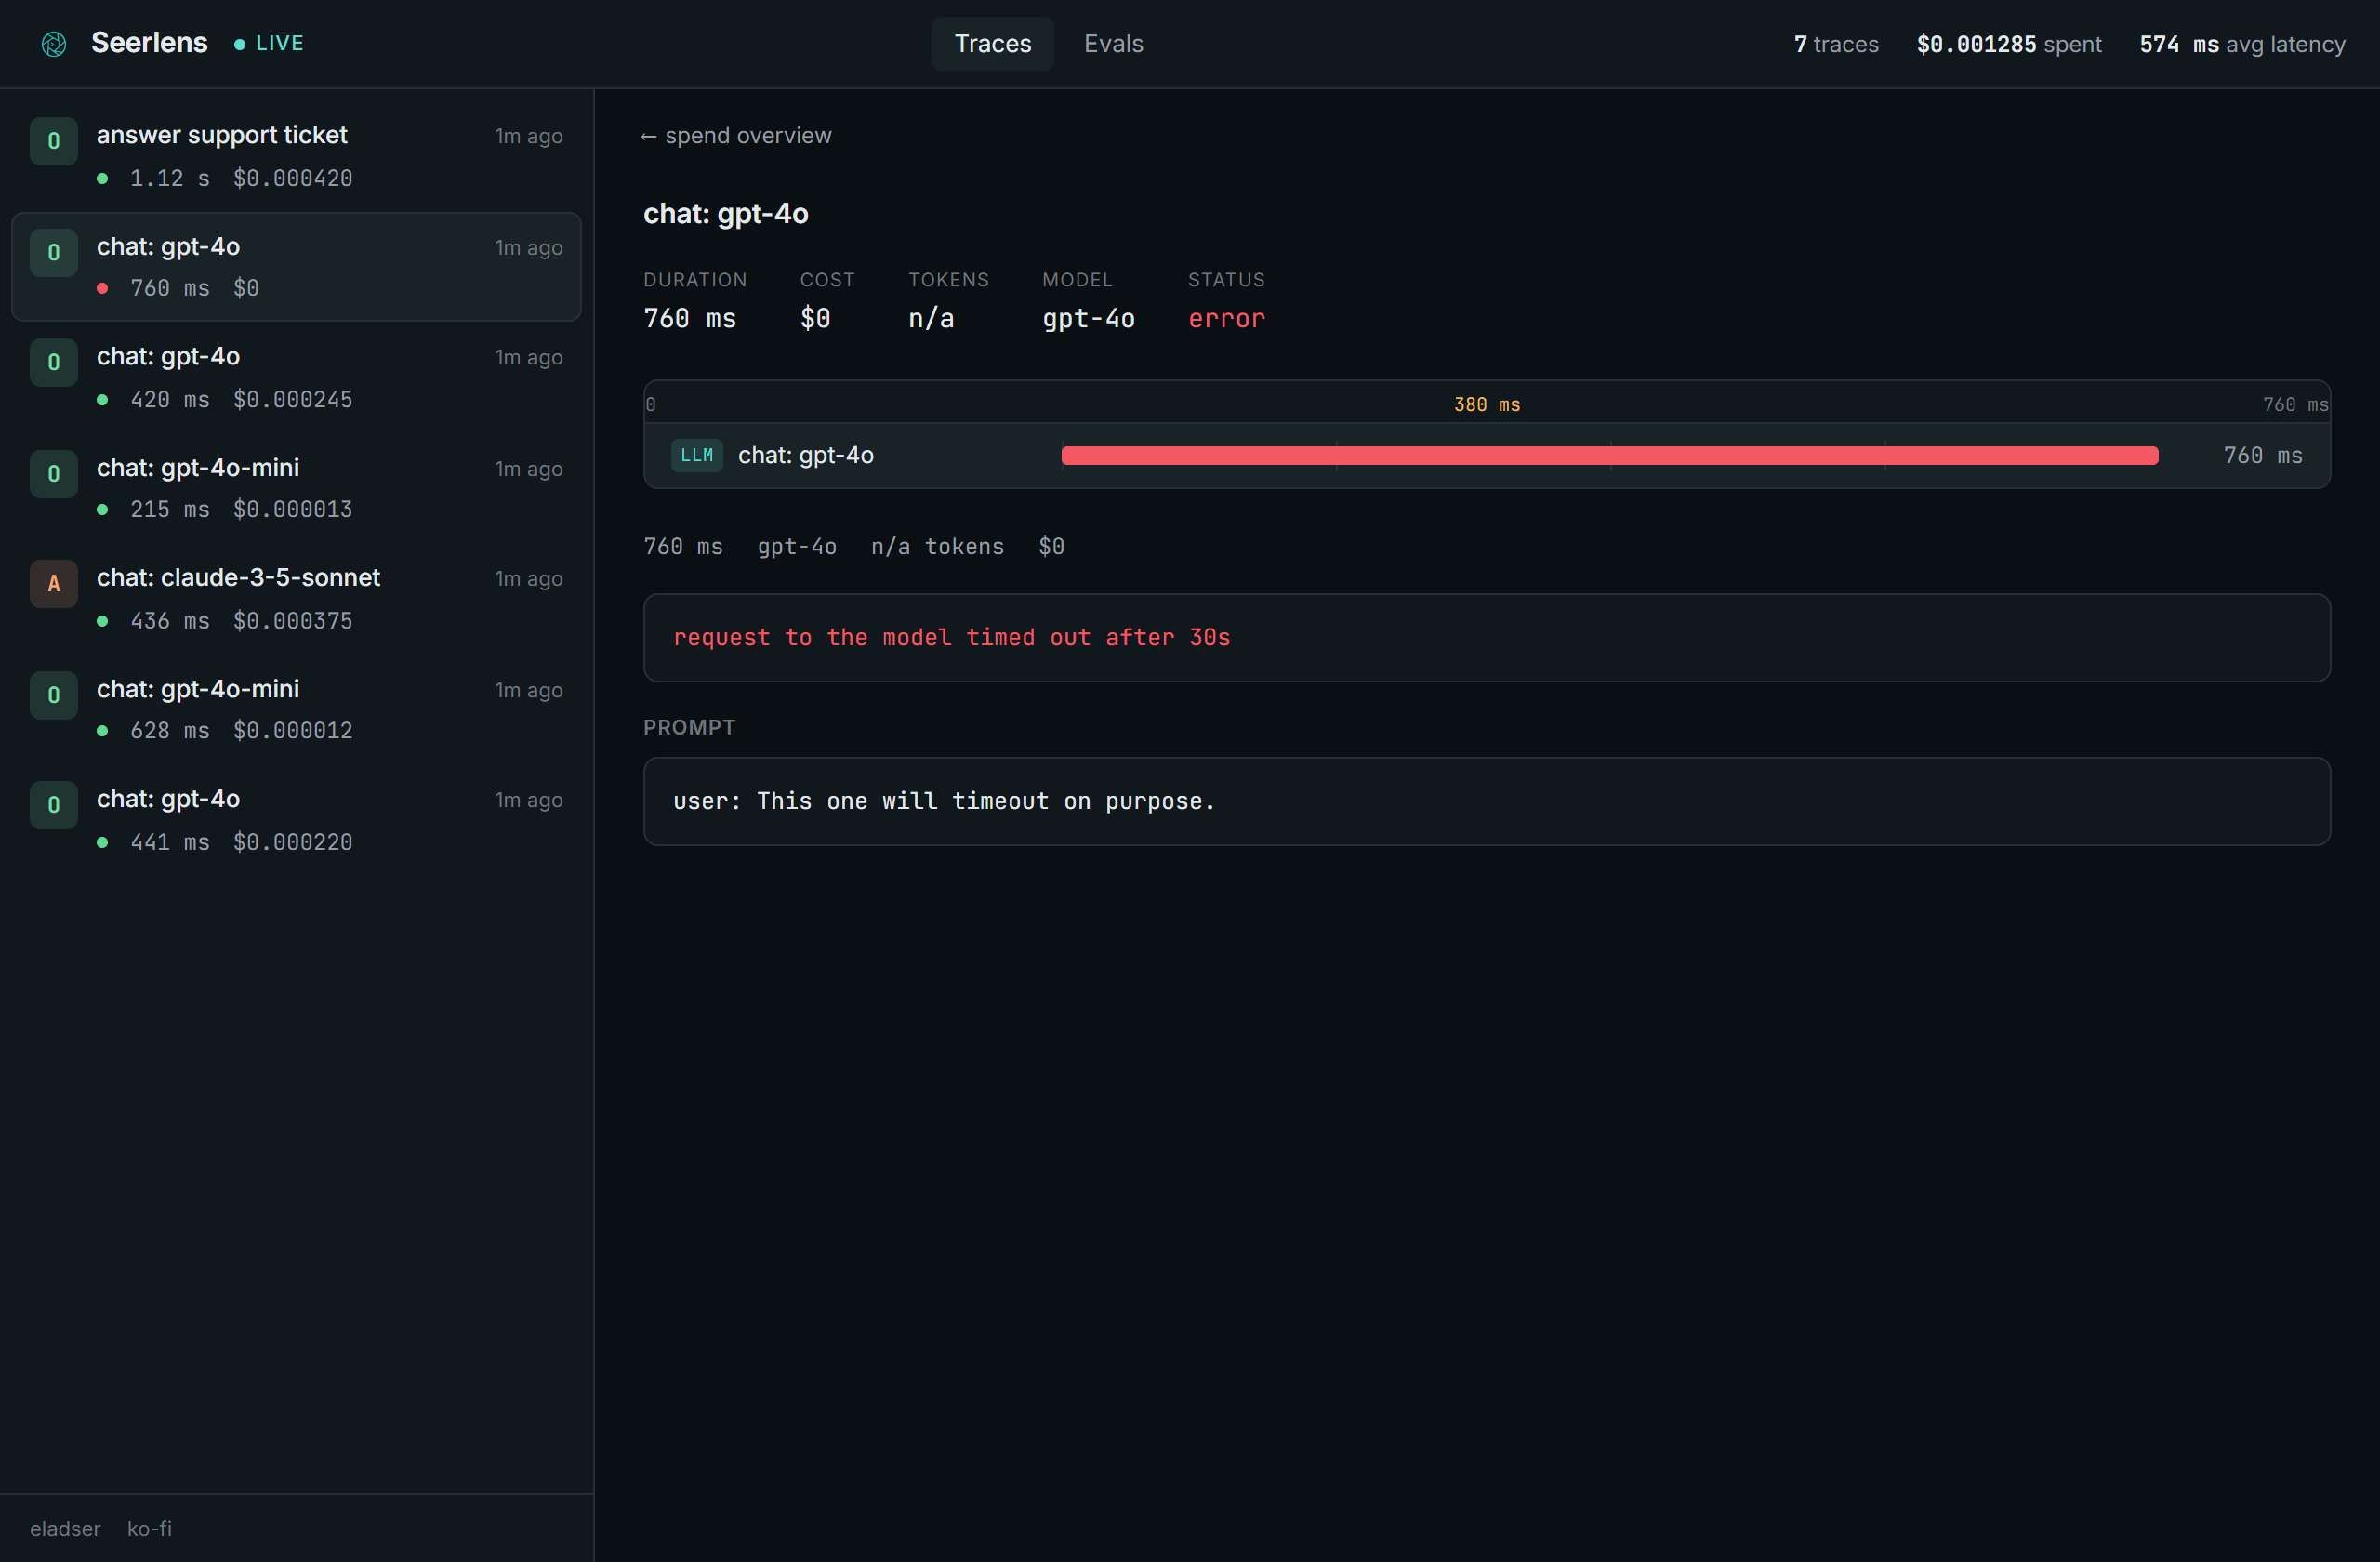
- Failures, captured. A call that throws is recorded with its error, so you can see what broke.
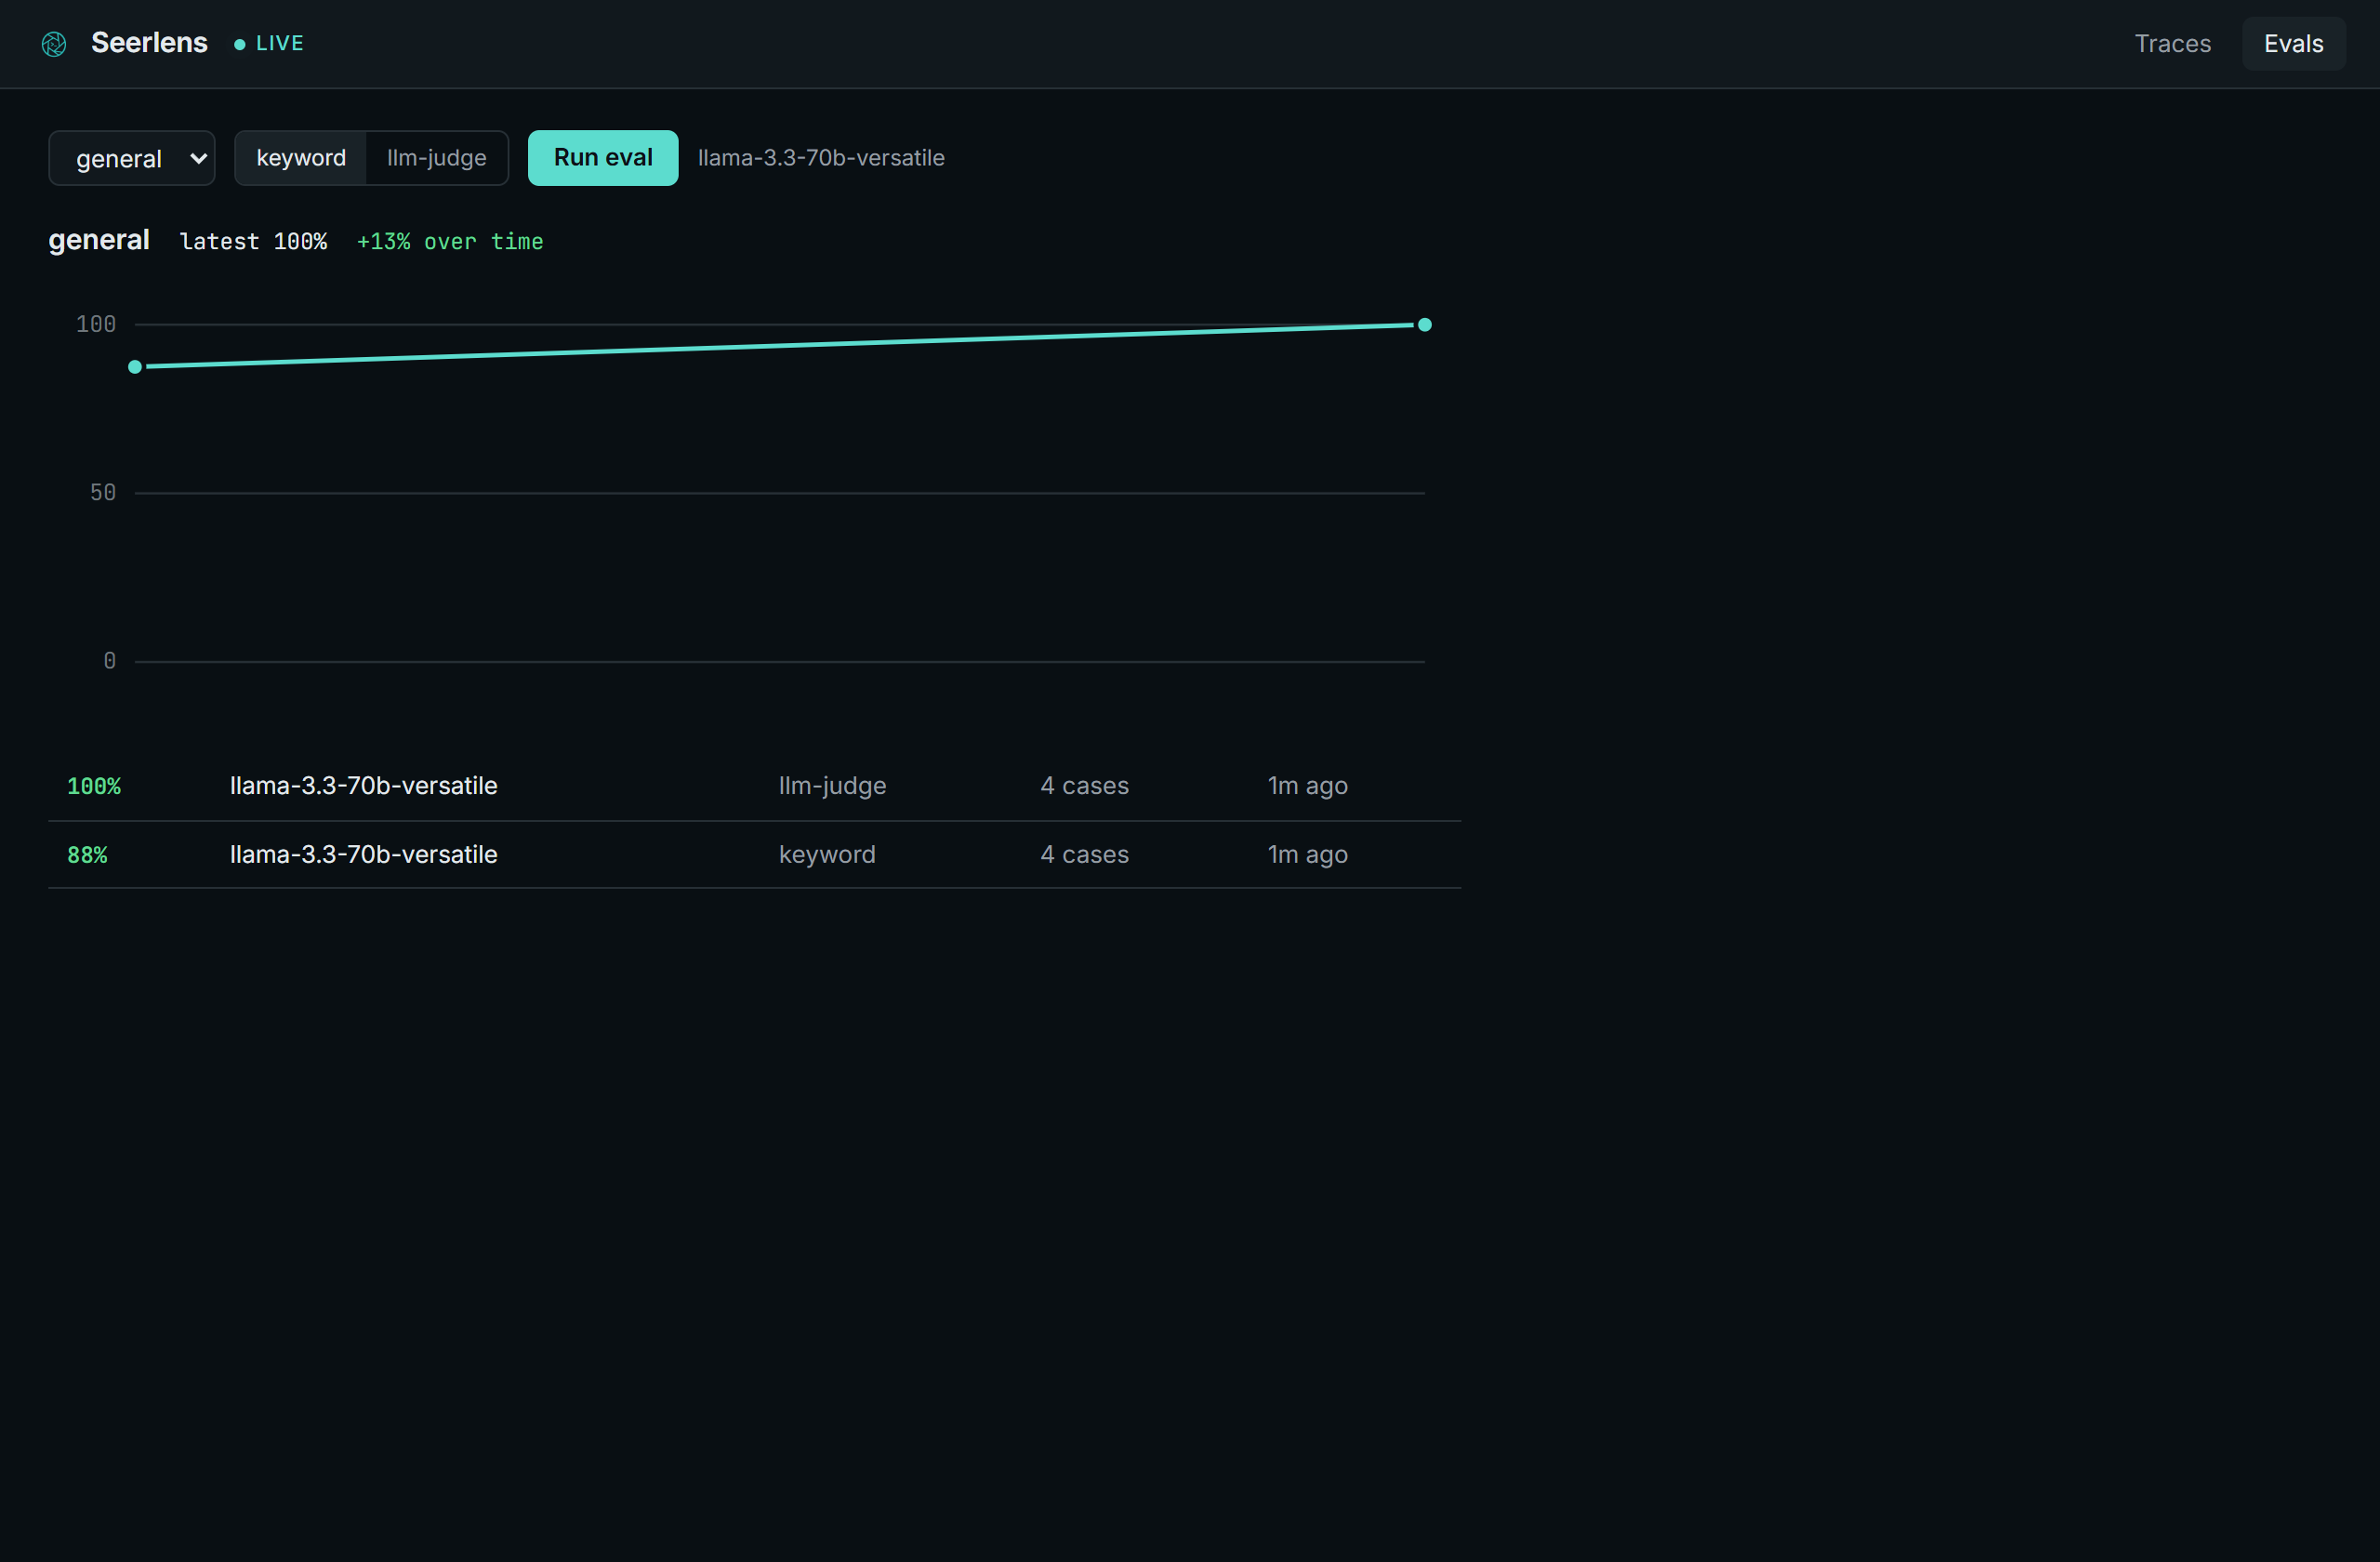
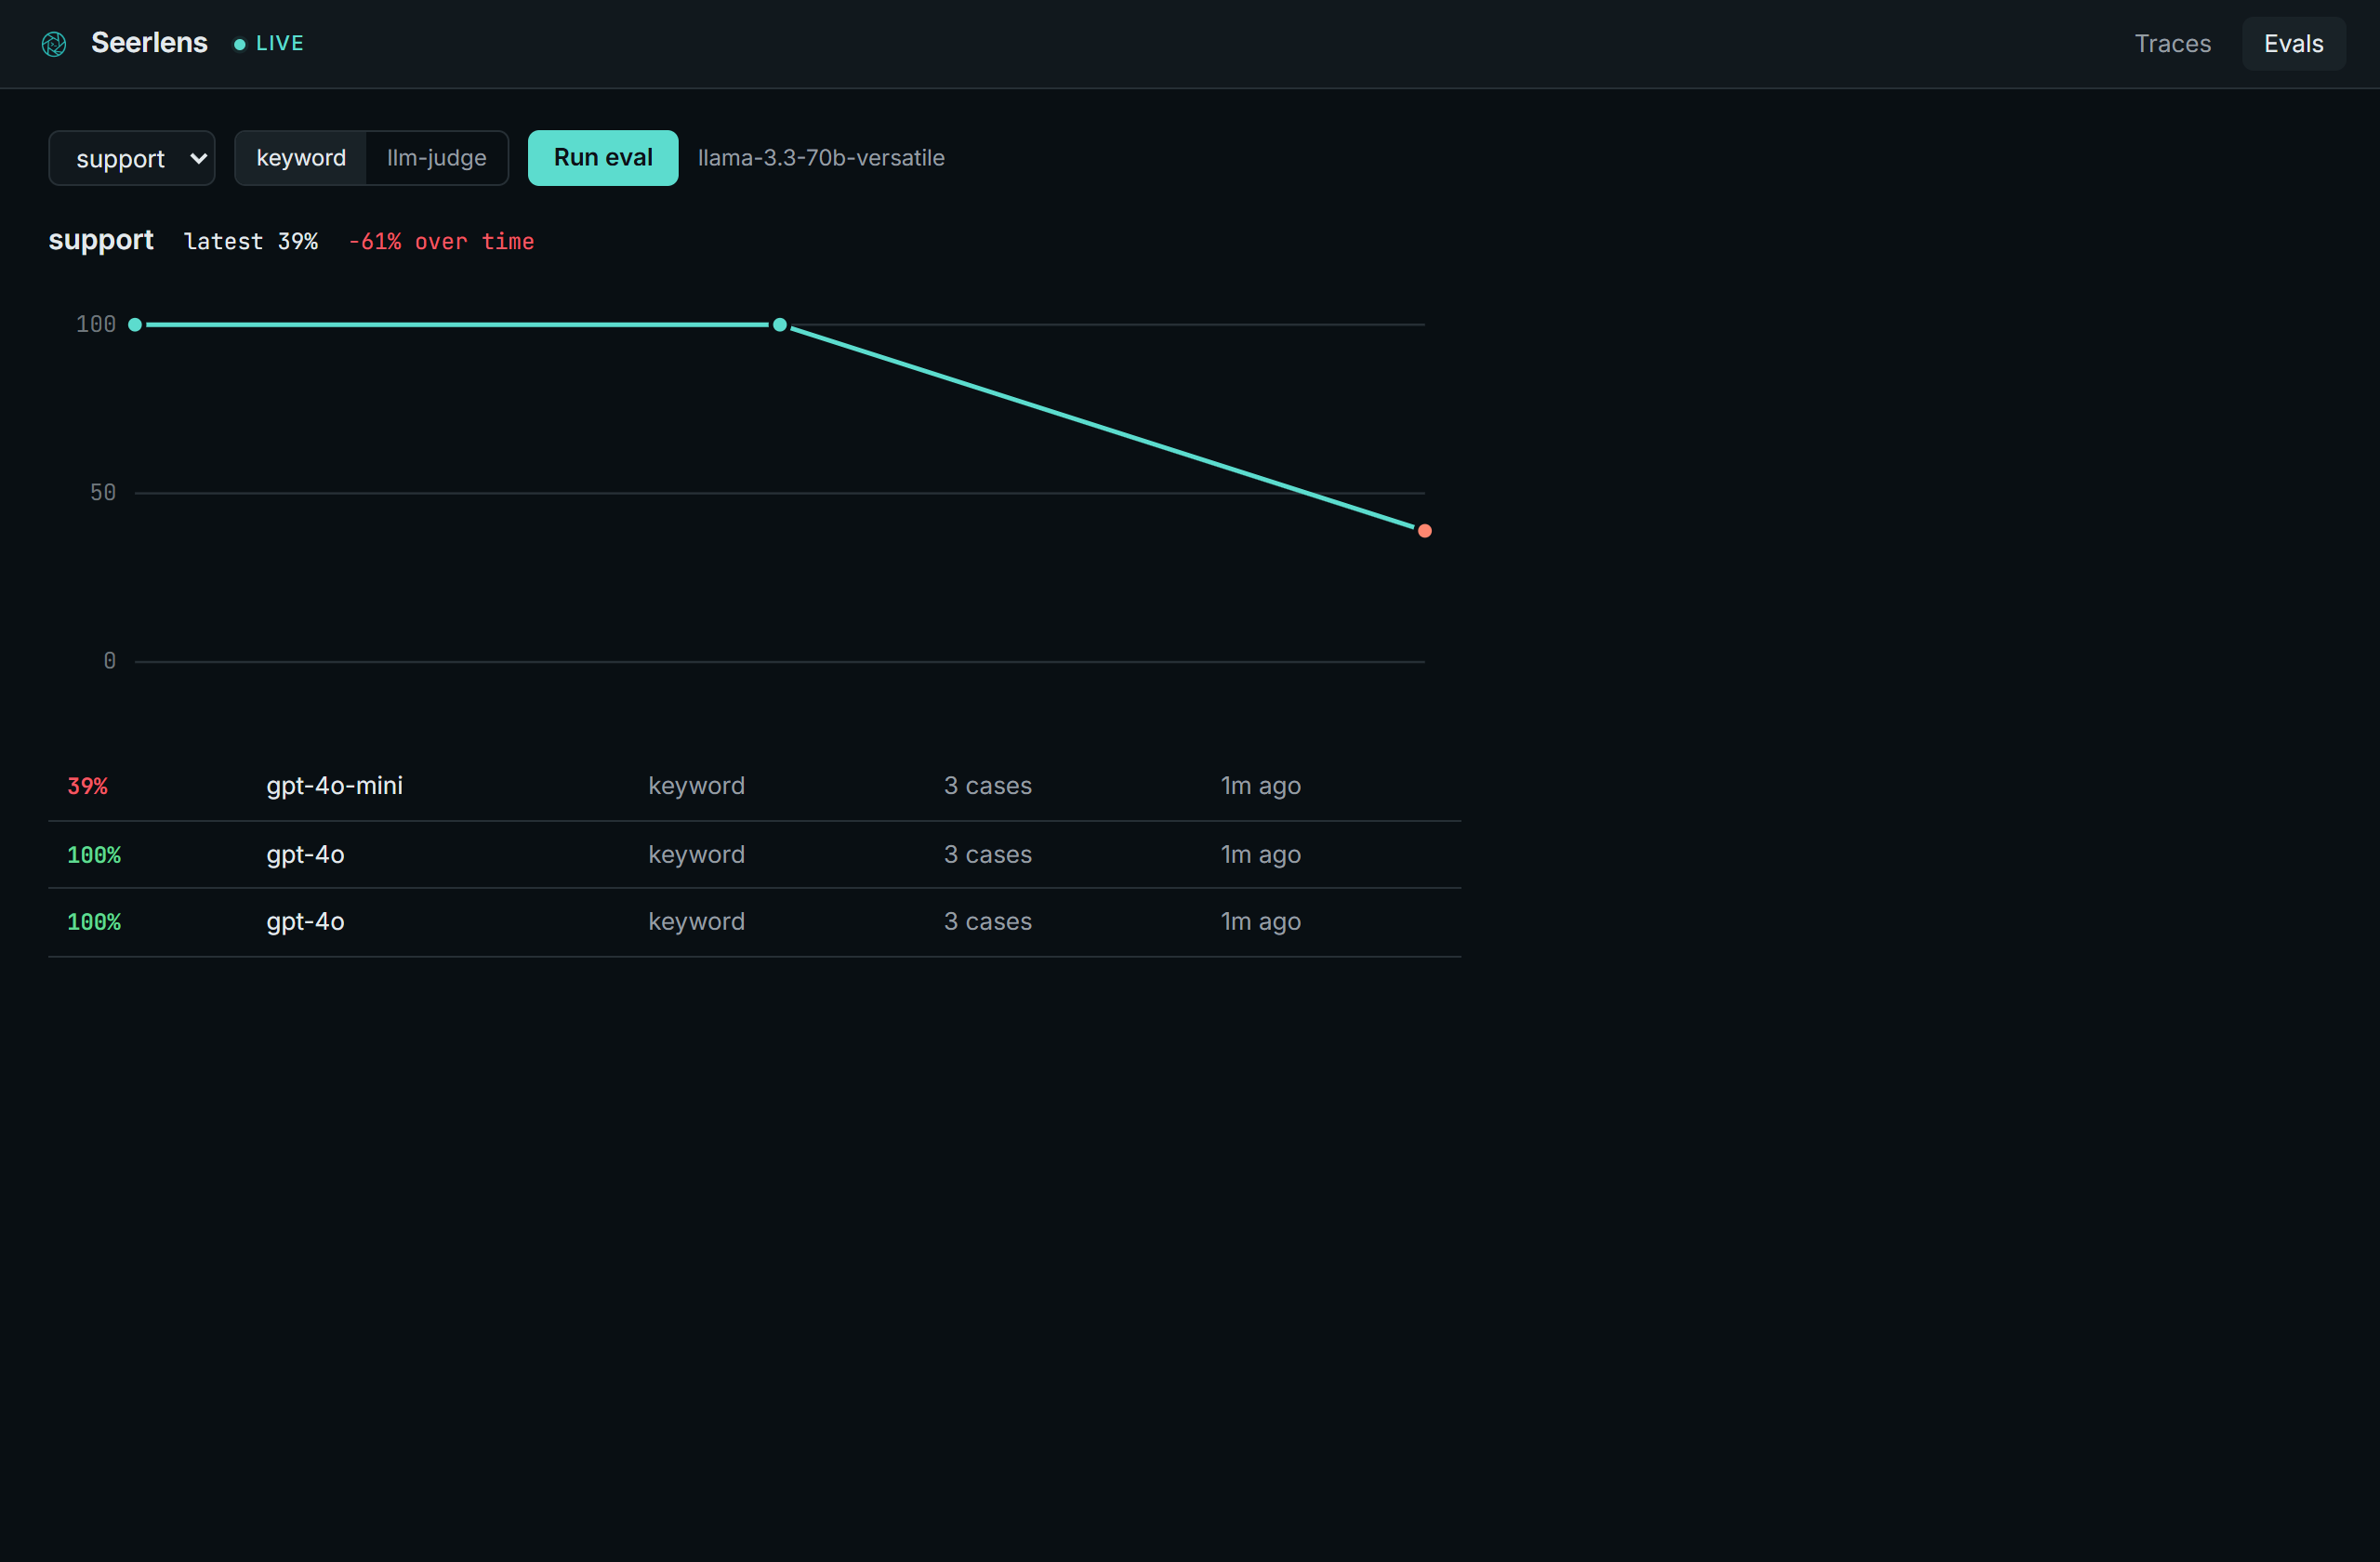
- Eval trends. Score a golden set against your prompts and watch the number over time, so a model swap that drops quality shows up as a line heading down, not a surprise in production.
Install the collector and run it:
dotnet tool install -g Seerlens
seerlens
That serves the dashboard at http://localhost:5005.
Then point your app at it. In .NET, wrap the IChatClient you already use:
using Seerlens.Sdk;

SeerlensTrace.Configure("http://localhost:5005");

IChatClient client = baseClient.UseSeerlens();
That's it. Every call through client shows up in the dashboard. To group a multi-step interaction (a couple of model calls with a tool lookup between them) into a single trace:
using (SeerlensTrace.Begin("answer support ticket"))
{
    await client.GetResponseAsync(messages);
    using (SeerlensTrace.Tool("lookupOrder"))
        order = await orders.Find(id);
    await client.GetResponseAsync(followup);
}
The SDK ships traces on a background queue. If the collector is down or busy, traces are dropped and your app keeps running. Instrumentation never blocks or throws into your code.
- Docker:
docker build -t seerlens . && docker run -p 127.0.0.1:5005:5005 seerlens - No .NET installed? Grab a self-contained build (
seerlens-win-x64.zip,linux-x64,osx-arm64) from the releases and run theseerlensbinary inside. - SDK on NuGet:
dotnet add package Seerlens.Sdk.
The collector has no auth, by design: it binds localhost and the Docker example publishes only to 127.0.0.1. It's a local dev tool. If you put it on a shared host or a network, gate it yourself, the captured prompts and your provider key are worth protecting.
The collector speaks OTLP, so any OpenTelemetry-instrumented app shows up at http://localhost:5005/v1/traces with no Seerlens SDK. There are also small SDKs for Python and JavaScript:
import seerlens
seerlens.configure("http://localhost:5005")

with seerlens.trace("answer ticket", model="gpt-4o") as span:
    reply = my_llm(prompt)
    span.complete(prompt=prompt, completion=reply, input_tokens=40, output_tokens=12)
import * as seerlens from 'seerlens'
seerlens.configure('http://localhost:5005')
const span = seerlens.trace('answer ticket', { model: 'gpt-4o' })
const reply = await myLlm(prompt)
span.complete({ prompt, completion: reply, inputTokens: 40, outputTokens: 12 })An eval is a quality test for your AI's answers, the part you can't catch with normal tests. AI doesn't crash when it gets worse, it just quietly gives worse answers. So you write a small set of questions where you know what a good answer looks like (a "golden set"), Seerlens runs them through a model and scores the answers, and a drop after a prompt tweak or a model swap shows up as the trend heading down.
You write the golden set, because only you know what a good answer is for your app. Drop a JSON file in evals/ next to the collector:
{
  "name": "support",
  "cases": [
    { "input": "What is your refund policy?", "keywords": ["30", "days"], "criteria": "states the refund window in days" },
    { "input": "Where is my order #5521?", "keywords": ["shipped"], "criteria": "says it shipped and gives an arrival day" }
  ]
}inputis a real question your app handles.keywordsare terms a good answer must contain (used by the offline scorer).criteriais a plain-English rubric the LLM judge grades against.
To run it, point the collector at any OpenAI-compatible provider:
# copy .env.local.example to .env.local next to the collector, or set env vars
SEERLENS_AI_BASE_URL=https://api.groq.com/openai/v1   # or OpenAI, Gemini, anything compatible
SEERLENS_AI_KEY=...
SEERLENS_AI_MODEL=llama-3.3-70b-versatile
Then pick the set in the Evals tab and hit Run. Both scorers send each question to the model to get an answer. keyword checks the answer for the expected terms (no extra calls); llm-judge asks the model to grade the answer against the criteria. The run lands on the trend.
Spend by provider and model, so you can see where the money goes:
A nested trace: model calls and tool calls on a real time ruler, with the exact prompt and completion:
Answer quality over time. Here the score falls off a cliff after a model swap:
The collector takes traces, stores them in a local SQLite file, and pushes new ones to the dashboard over server-sent events. It accepts both a small JSON contract (what the .NET SDK posts) and raw OpenTelemetry traces at /v1/traces, normalizing GenAI spans from either into one model. The dashboard is a small React app the collector serves itself.
your app ──► Seerlens SDK (or any OTLP exporter) ──► collector ──► SQLite
                                                          │
                                                          └──► live feed (SSE) ──► dashboard
| Piece | What it is |
|---|---|
Seerlens.Sdk |
.NET SDK. An IChatClient wrapper plus a small API for grouping traces. |
Seerlens.Evals |
Golden sets, scorers (keyword or LLM-as-judge), and a runner that scores your prompts and reports the run. |
Seerlens.Collector |
ASP.NET Core app. Trace and eval ingest, SQLite store, live feed, and it serves the dashboard. Packaged as the seerlens tool. |
dashboard |
React + TypeScript UI. Trace timeline, cost and token rollups, and the eval trend. |
# build the dashboard into the collector
cd dashboard && npm install && npm run build && cd ..

# run the collector
dotnet run --project src/Seerlens.Collector

# in another shell, send some sample traces
dotnet run --project samples/ChatSample
The sample uses a fake model client, so it runs without any API keys.
dotnet test                           # collector + .NET SDK
cd sdk/python && python -m unittest    # python SDK
cd sdk/js && node --test               # js SDK
The .NET tests cover the store and pricing, OTLP span mapping, the ingest and eval endpoints, and the SDK's safety contract (it records on success, rethrows real errors, and a broken collector can't break the host app). The Python and JS tests check the OTLP payload each SDK builds. All three suites run in CI on every push.
Tracing with SDKs for .NET, Python, and JavaScript, OTLP ingest for everything else, and eval trends scored by keyword or an LLM judge, run straight from the dashboard. Next up, evals get deeper (full plan in the roadmap):
- Evals in CI, a command that fails the build when answer quality drops.
- Model comparison, run a golden set across models and see quality and cost side by side.
- Author evals in the dashboard, including turning a real trace into a test case.
Elad Sertshuk, a full-stack engineer who builds developer tools.
- GitHub: @eladser
- LinkedIn: elad-sertshuk
- Site: eladser.dev
If Seerlens saved you some time, you can buy me a coffee.
MIT