Use display-name or context path as the default service name #514
Conversation
Enables to have multiple service names per JVM,
one per class loader.

closes elastic#136
… class loader

test context path based service name
 eyalkoren
left a comment
eyalkoren
left a comment
There was a problem hiding this comment.
LGTM. A few minor comments.
One concern: elastic/apm-server#1175 means that the service.name overrides the one from metadata, right? If so, this PR practically makes it impossible for Java agent user to manually set the general service name for the agent, right? If so, we need to come up with a good configuration that will allow that.
...pm-servlet-plugin/src/test/java/co/elastic/apm/agent/servlet/ServletInstrumentationTest.java
Outdated
Show resolved
Hide resolved
docs/configuration.asciidoc
Outdated
| ==== `transaction_sample_rate` | ||
|
|
||
| By default, the agent will sample every transaction (e.g. request to your service). To reduce overhead and storage requirements, you can set the sample rate to a value between 0.0 and 1.0. We still record overall time and the result for unsampled transactions, but no context information, labels, or spans. | ||
| By default, the agent will sample every transaction (e.g. request to your service). To reduce overhead and storage requirements, you can set the sample rate to a value between 0.0 and 1.0. We still record overall time and the result for unsampled transactions, but no context information, tags, or spans. |
There was a problem hiding this comment.
I fixed this in my PR (ie change in CoreConfiguration.java), so no need to fix if you encounter this
There was a problem hiding this comment.
This was just a byproduct of executing the tests 🙂 (ConfigurationExporterTest)
There was a problem hiding this comment.
Yes, I meant I updated the origin (the java class) in my PR
...tion-tests/src/test/java/co/elastic/apm/servlet/AbstractServletContainerIntegrationTest.java
Outdated
Show resolved
Hide resolved
|
One more thing- if the automatic service name discovery is on by default, it means that users upgrading to the new server version that support that should get a warning in advance that their data is going to be presented/aggregated differently. I am not sure whether it is something we should document or server, probably depends on how relevant this is for other agents 🤔 . |
Set initiating class loader for public API, OT API and trace_methods
It currently is already optional
But how can they then override just the default service_name which is relevant for the metrics? Also, it would not allow to have multiple custom service names. What about providing the ability to set a custom service_name per servlet context path? We could also add an option to disable the automatic detection of the service name. Not sure if that would be useful though 🤔. |
…@CaptureTransaction

Relying on `this` would not work for static methods
|
@kuisathaverat seems Jenkins has problems to clone this PR. Do you have an idea how to fix that? |
Another idea would be to just report the metrics multiple times if there are multiple applications on one JVM - once for each distinct service name. Then we could actually make it so that if the @gregkalapos do you have similar considerations in the .NET agent? |
|
@felixbarny I have seen you resolved the merge conflict |
|
I believe our data model is missing something here, which makes it so difficult...
and see how we tackle the broader problem when we introduce app-specific metrics. Hopefully we will have something to identify the entire JVM/agent-instance by then |
Codecov Report
@@            Coverage Diff            @@
##             master     #514   +/-   ##
=========================================
  Coverage     65.39%   65.39%
  Complexity       68       68
=========================================
  Files           175      175
  Lines          6903     6903
  Branches        835      835
=========================================
  Hits           4514     4514
  Misses         2136     2136
  Partials        253      253
Continue to review full report at Codecov.
|

|
Going with @roncohen's call for now:
Even when the APM Server adds support for specifying multiple service names, we will have to do a version check and only do that on APM Server versions which support that. If we would now send the metrics in multiple requests with different metadata, we could never get rid of that code as the agent might be used with an older APM Server version. Will add docs for that caveat (metrics UI not working when) in the |
|
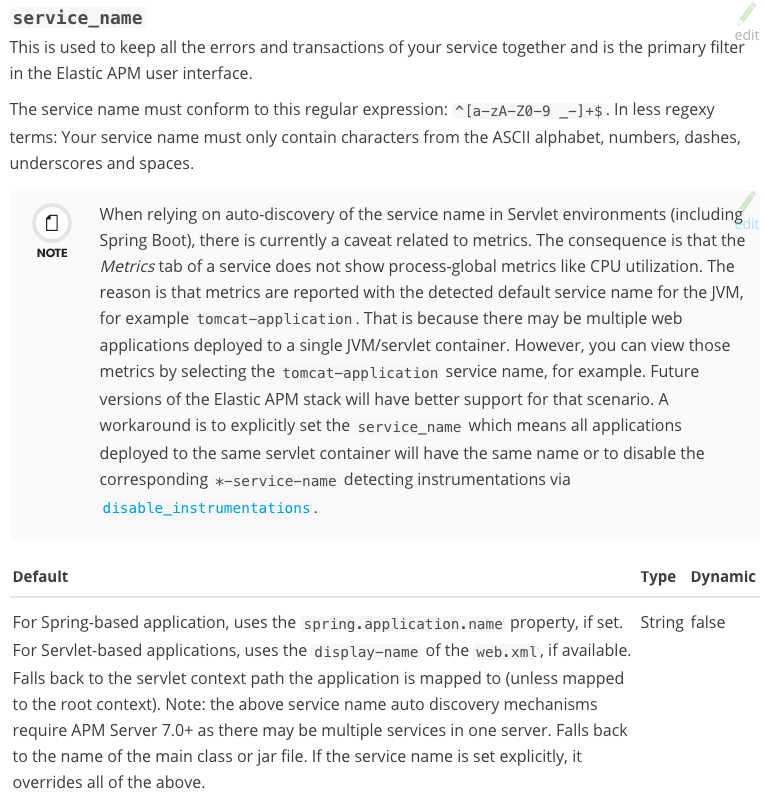
This is how the docs would look like: Edit: reflect changes in 58076a0
|
eyalkoren
left a comment
There was a problem hiding this comment.
Our changelog and release notes should emphasize this change in BOLD CAPITALS- anyone upgrading to 1.5.0+ and not specifying the service_name will get their data completely changed
docs/configuration.asciidoc
Outdated
| # NOTE: When relying on auto-discovery of the service name in Servlet environments, | ||
| # there is currently a caveat related to metrics. | ||
| # + | ||
| # The consequence is that the 'Metrics' tab of a service does not show process-global metrics like CPU utilizationif the corresponding service name has been auto-discovered based on the `web.xml`'s `display-name` or the servlet context path. |
There was a problem hiding this comment.
| # The consequence is that the 'Metrics' tab of a service does not show process-global metrics like CPU utilizationif the corresponding service name has been auto-discovered based on the `web.xml`'s `display-name` or the servlet context path. | |
| # The consequence is that the 'Metrics' tab of a service does not show process-global metrics like CPU utilization if the corresponding service name has been auto-discovered based on the `web.xml`'s `display-name` or the servlet context path. |
docs/configuration.asciidoc
Outdated
| # The consequence is that the 'Metrics' tab of a service does not show process-global metrics like CPU utilizationif the corresponding service name has been auto-discovered based on the `web.xml`'s `display-name` or the servlet context path. | ||
| # The reason is that metrics are reported with the detected default service name, | ||
| # for example `tomcat-application`. | ||
| # + |
There was a problem hiding this comment.
Maybe add a clarification that this means system metrics can still be viewed when service names are detected automatically, but through the fallback service name.
|
Test observations: when running a spring boot application with an embedded server which has set It's tempting to only report metrics after there has been at least one recorded transaction. But reporting metrics without instrumenting the application is a real use case so we can't really do that. We could disable Even when we do have support specifying multiple service names for metrics, we'd still have the situation that there is a service in the service list, representing a servlet container, which may never have actual traces. Removing services which can never have traces and allowing to track metrics without collecting traces are, however, contradicting goals. We could introduce a filter in the services list UI to only show services with actual traces but that would also hide applications which have just been started and no traces have yet been collected. Not showing those in the services list has lead to confusion for users and several discuss topics. That's why we now also show services without traces but with metrics. |
I was also tempted to suggest using the first transaction to decide on the metrics service, but didn't because it means no consistency is guaranteed, so you could get the metrics under different service names in different restarts...
I see what you're saying, but I don't think we need to go down this path (which is not limited to spring apps). We decided to provide this capability for those that see the lack of it blocking them from using us, with the decision we will make it better in the future. It can be imperfect now as long as we provide the escape from it through the
Again, don't forget we still have the manual configuration to deal with this kind of cases in the first place
If we don't include the fallback service name in the list sent within the metrics document, and only rely on the discovered service name cache, we will make it a bit better. However, we may get metrics reported for this service name every restart before the first transaction occurs, so this service will show up for long-enough time ranges... This is a more general problem I think- the fact that we rely on discovery means that service names may be accumulated in metrics documents over time after each restart. |
Enables to have multiple service names per JVM,
one per class loader.
closes #136
Checklist
transaction.context.service.nameas opposed totransaction.service.namespring.application.nameanddisplay-namedetection.