This issue was moved to a discussion.
You can continue the conversation there. Go to discussion →
Announcements and New Features (2020) #48
Comments
Filled Plots (v0.3 - 6/1/2020)
|
Support for
|
Colormaps and Heatmaps (v0.3 - 6/2/2020)ImPlot now provides several built-in colormaps (previously "palettes").
Heatmap Charts have been added. An optional utility function can be used to render a colormap scale. (Note the artifacting below is due to GIF compression. See the demo for a better representation.).
|

User Defined Ticks (v0.3 - 6/3/2020)Users can now add custom ticks to any axis. The ticks can optionally be decorated with a custom string label. The default generated ticks will be hidden by default, but can be kept if desired.
|


16-bit Indices (v0.3 - 6/7/2020)Issues related to data truncation and glitching when using 16-bit indices have been resolved by #41 and ocornut/imgui@f6120f8 Therefore it is important that you are using the latest version of ImGui to avoid glitching. 32-bit indices continue to work as before. Moving forward, we recommend that users stick to 16-bit indices if possible. You may see a slight performance boost from this, and it is recommended by ImGui for compatibility's sake. Special thanks to @sergeyn and @ocornut for their work on this. |
Horizontal Error Bars (v0.3 - 6/8/2020)@ChiefSeaBiscuit has added support for horizontal error bars.
|

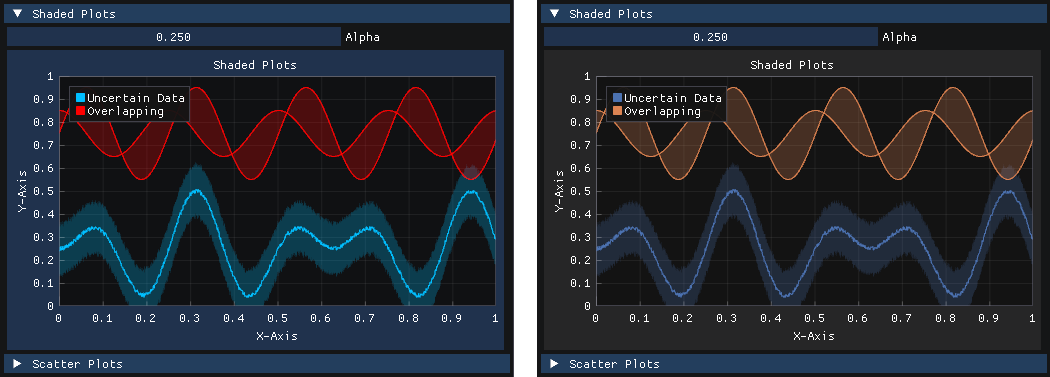
PlotShaded (v0.4 - 6/14/2020)
|


ImPlotInputMap (v0.4 - 6/15/2020)@JaapSuter has added support for input remapping. The current input mapping can be retrieved and modified with struct ImPlotInputMap {
ImGuiMouseButton PanButton; // LMB enables panning when held
ImGuiKeyModFlags PanMod; // none optional modifier that must be held for panning
ImGuiMouseButton FitButton; // LMB fits visible data when double clicked
ImGuiMouseButton ContextMenuButton; // RMB opens plot context menu (if enabled) when double clicked
ImGuiMouseButton BoxSelectButton; // RMB begins box selection when pressed and confirms selection when released
ImGuiKeyModFlags BoxSelectMod; // none optional modifier that must be held for box selection
ImGuiMouseButton BoxSelectCancelButton; // LMB cancels active box selection when pressed
ImGuiMouseButton QueryButton; // MMB begins query selection when pressed and end query selection when released
ImGuiKeyModFlags QueryMod; // none optional modifier that must be held for query selection
ImGuiKeyModFlags QueryToggleMod; // Ctrl when held, active box selections turn into queries
ImGuiKeyModFlags HorizontalMod; // Alt expands active box selection/query horizontally to plot edge when held
ImGuiKeyModFlags VerticalMod; // Shift expands active box selection/query vertically to plot edge when held
ImPlotInputMap();
};This is somewhat experimental, and it may not enable all desired input approaches. If you find that you need more control/options, please submit an Issue or PR. |
Invisible Legend Entries (v0.4 - 6/23/2020)Plot items with labels entirely prefixed with ImPlot::PlotLine("MyData1",x,y); // displays "MyData1" in legend
ImPlot::PlotLine("MyData##2",x,y); // displays "MyData" in legend
ImPlot::PlotLine("##MyData3",x,y); // no legend entry displayed |
Axis Hovering (v0.4 - 7/26/2020)Axes can now be checked to see if they are hovered with
On a similar note, Special thanks to @ozlb! |

Explicit ImPlotContexts and Major Refactors (v0.5 - 8/16/2020)Previously, the main ImPlot context and state manager was statically initialized in In v0.5 and onward, you must manually initialize and destroy an ImGui::CreateContext();
ImPlot::CreateContext();
...
ImPlot::DestroyContext();
ImGui::DestroyContext();You can keep a pointer to each ImPlot v0.5 also brings about major refactors to the internal code base as proposed in #70. A substantial portion of ImPlot's guts have been exposed in Additionally, source code for rendering plot items has been moved to Overall, these changes should not cause significant headaches for end-users. If you notice that something isn't working as it previously did, please submit an Issue or PR. |
Per Axis Context Menus (v0.5 - 8/19/2020)Individual axes can be double clicked to open their own context menus:
|

Styling Overhaul (v0.5 - 08/23/2020)A number of improvements have been made to ImPlot's styling API. As before, ImPlot, by default, will automatically deduce plot colors based on your current ImGui style. However, it is now possible to customize nearly every aspect of plot styles. Both
Using the Style Editor, you can create your own custom style or replicate the look of your other favorite plotting library. For example, here's an example replicating the look of seaborn (shown in the demo under
Styles can be saved to memory, or exported to the clipboard or console. Additionally, colormaps can now be pushed and popped with |


Built-In Style Colors (v0.5 - 8/24/2020)Three built-in style color sets were added. The three styles have been tuned to complement the default ImGui styles Classic, Dark, and Light. Automatic styling from the current ImGui style remains the default. The styles can be set with: // Style colors from current ImGui style (default)
void StyleColorsAuto(ImPlotStyle* dst = NULL);
// Style colors for ImGui "Classic".
void StyleColorsClassic(ImPlotStyle* dst = NULL);
// Style colors for ImGui "Dark".
void StyleColorsDark(ImPlotStyle* dst = NULL);
// Style colors for ImGui "Light".
void StyleColorsLight(ImPlotStyle* dst = NULL);Here you can see the difference between default Classic + ImPlotColormap_Pastel
Dark + ImPlotColormap_Deep
Light + ImPlotColormap_Deep
|


Next Item Styling Functions (v0.5 - 9/1/2020)The following functions have been added so that you can conveniently style items without pushing/popping style variables. The demo has been updated to use these where applicable. // The following can be used to modify the style of the next plot item ONLY. They do
// NOT require calls to PopStyleX. Leave style attributes you don't want modified to
// IMPLOT_AUTO or IMPLOT_AUTO_COL. Automatic styles will be deduced from the current
// values in the your ImPlotStyle or from Colormap data.
// Set the line color and weight for the next item only.
void SetNextLineStyle(const ImVec4& col = IMPLOT_AUTO_COL, float weight = IMPLOT_AUTO);
// Set the fill color for the next item only.
void SetNextFillStyle(const ImVec4& col = IMPLOT_AUTO_COL, float alpha_mod = IMPLOT_AUTO);
// Set the marker style for the next item only.
void SetNextMarkerStyle(ImPlotMarker marker = IMPLOT_AUTO, float size = IMPLOT_AUTO, const ImVec4& fill = IMPLOT_AUTO_COL, float weight = IMPLOT_AUTO, const ImVec4& outline = IMPLOT_AUTO_COL);
// Set the error bar style for the next item only.
void SetNextErrorBarStyle(const ImVec4& col = IMPLOT_AUTO_COL, float size = IMPLOT_AUTO, float weight = IMPLOT_AUTO);For example: if (ImPlot::BeginPlot("My Plot")) {
ImPlot::SetNextLineStyle(ImVec4(1,1,0,1));
ImPlot::SetNextMarkerStyle(ImPlotMarker_Square);
ImPlot::PlotLine("yellow line with square markers", xs, ys, 10);
ImPlot::EndPlot();
} |
Legend Utilities - (v0.5 - 9/1/2020)Two new legend utilities are available, thanks to @PeterJohnson! The first allows for legend entries to be used as drag and drop sources. You can uses this to rearrange items on a single plot, move items between plots, or however else you choose. // Begin a drag and drop source from a legend entry. The only supported flag is SourceNoPreviewTooltip
bool BeginLegendDragDropSource(const char* label_id, ImGuiDragDropFlags flags = 0);
// End legend drag and drop source.
void EndLegendDragDropSource();
The second allows you to add context popup menus to legend entries. You can use this to inject item specific functionality, controls, styling options, etc. // Begin a popup for a legend entry.
bool BeginLegendPopup(const char* label_id, ImGuiMouseButton mouse_button = 1);
// End a popup for a legend entry.
void EndLegendPopup();
|

PlotStems - (v0.6 - 9/2/2020)Vertical stem plots have been added. /// Plots vertical stems.
void PlotStems(const char* label_id, const float* values, int count, float y_ref = 0, int offset = 0, int stride = sizeof(float));
void PlotStems(const char* label_id, const double* values, int count, double y_ref = 0, int offset = 0, int stride = sizeof(double));
void PlotStems(const char* label_id, const float* xs, const float* ys, int count, float y_ref = 0, int offset = 0, int stride = sizeof(float));
void PlotStems(const char* label_id, const double* xs, const double* ys, int count, double y_ref = 0, int offset = 0, int stride = sizeof(double));
|

Simplified Flags - (v0.7 - 9/6/2020)Usage of The rational for this decision was that:
BeginPlot("plot", "x", "y", ImVec2(0,0), 0, ImPlotFlags_LogScale)instead of what was previously required: BeginPlot("plot", "x", "y", ImVec2(0,0), ImPlotFlags_Default, ImPlotAxisFlags_Default | ImPlotFlags_LogScale) |
Date/Time Formatting - (v0.7 9/7/2020)Long overdue support for date/time formatting has finally been added (see #34 for history). The feature can be enabled with the flag
Special thanks to @Prinkesh for their initial PR, and @leeoniya for providing help and insight as well as offering a great example to go off of in his library uPlot. Demo Example
Sub-Second Precision
UTC/Local Time
Candlestick Demo
|


Linked Plot Limits - (v0.7 - 9/6/2020)You can now link plot limits to externally owned values with static double xmin = 0, xmax = 1, ymin = 0, ymax = 1;
double data[2] = {0,1};
ImPlot::LinkNextPlotLimits(&xmin, &xmax, &ymin, &ymax);
if (ImPlot::BeginPlot("Plot A")) {
ImPlot::PlotLine("Line",data,2);
ImPlot::EndPlot();
}
ImPlot::LinkNextPlotLimits(&xmin, &xmax, &ymin, &ymax);
if (ImPlot::BeginPlot("Plot B")) {
ImPlot::PlotLine("Line",data,2);
ImPlot::EndPlot();
}
|

Support for Scalar Types - (v0.8 - 9/7/2020)All plotting functions now support the following types:
Since those types are just This was accomplished by forward declaring templated versions of the API in Consequently, I had to introduce a Usage of different types has been sprinkled throughout the demo. See #104 for more information and detail. |
Date/Time Pickers - (v0.8 - 9/9/2020)When
|


xscale and x0 - (v0.8 - 9/10/2020)The single array version (i.e. Note that if you were using these functions previously with
|

PlotImage - (v0.8 - 9/17/2020)You can now add images to plots: // Plots an axis-aligned image. #bounds_min/bounds_max are in plot coordinatse (y-up) and #uv0/uv1 are in texture coordinates (y-down).
void PlotImage(const char* label_id, ImTextureID user_texture_id, const ImPlotPoint& bounds_min, const ImPlotPoint& bounds_max, const ImVec2& uv0=ImVec2(0,0), const ImVec2& uv1=ImVec2(1,1), const ImVec4& tint_col=ImVec4(1,1,1,1));
|

Annotations - (v0.8 - 9/19/2020)An API for annotating plots has been added. Points can be annotated with the following: void Annotate(double x, double y, const ImVec2& pix_offset, const char* fmt, ...);
void Annotate(double x, double y, const ImVec2& pix_offset, const ImVec4& color, const char* fmt, ...);
void AnnotateClamped(double x, double y, const ImVec2& pix_offset, const char* fmt, ...);
void AnnotateClamped(double x, double y, const ImVec2& pix_offset, const ImVec4& color, const char* fmt, ...);
|

Drag Lines and Points - (v0.8 - 9/19/2020)New tools for creating draggable reference lines and points have been added. You can use these to enhance the interactivity of your plot. Special thanks to @bear24rw and @ozlb for the initial idea. bool DragLineX(const char* id, double* x_value, bool show_label = true, const ImVec4& col = IMPLOT_AUTO_COL, float thickness = 1);
bool DragLineY(const char* id, double* y_value, bool show_label = true, const ImVec4& col = IMPLOT_AUTO_COL, float thickness = 1);
bool DragPoint(const char* id, double* x, double* y, bool show_label = true, const ImVec4& col = IMPLOT_AUTO_COL, float radius = 4);
|


ISO 8601 Date Formatting - (v0.8 - 10/18/2020)Non-US users rejoice! Date formatting using ISO 8601 can now be enabled with
|

Configurable Legend Locations - (v0.8 - 10/18/2020)You can now configure the location and orientation of each plot's legend: // Used to position items on a plot (e.g. legends, labels, etc.)
enum ImPlotLocation_ {
ImPlotLocation_Center = 0, // center-center
ImPlotLocation_North = 1 << 0, // top-center
ImPlotLocation_South = 1 << 1, // bottom-center
ImPlotLocation_West = 1 << 2, // center-left
ImPlotLocation_East = 1 << 3, // center-right
ImPlotLocation_NorthWest = ImPlotLocation_North | ImPlotLocation_West, // top-left
ImPlotLocation_NorthEast = ImPlotLocation_North | ImPlotLocation_East, // top-right
ImPlotLocation_SouthWest = ImPlotLocation_South | ImPlotLocation_West, // bottom-left
ImPlotLocation_SouthEast = ImPlotLocation_South | ImPlotLocation_East // bottom-right
};
// Used to orient items on a plot (e.g. legends, labels, etc.)
enum ImPlotOrientation_ {
ImPlotOrientation_Horizontal, // left/right
ImPlotOrientation_Vertical // up/down
};
// Set the location of the current plot's legend.
void SetLegendLocation(ImPlotLocation location, ImPlotOrientation orientation = ImPlotOrientation_Vertical, bool outside = false);You can also change the location of the mouse position label text: // Set the location of the current plot's mouse position text (default = South|East).
void SetMousePosLocation(ImPlotLocation location);Usage: if (ImPlot::BeginPlot("##Legend","x","y",ImVec2(-1,0))) {
ImPlot::SetLegendLocation(ImPlotLocation_South, ImPlotOrientation_Horizontal, true);
...
ImPlot::EndPlot();
}Demo:
Note that you may experience popping/shifting for outside legends on the first and second frames of a plot. This is because we don't know the labels in a legend and thus the legend's size until the second frame. There isn't much we can do about this at the moment; it's just a limitation of being an immediate mode plotting library :) |

Stairstep Plots - (v0.8 - 10/19/2020)Stairstep plots have been added: // Plots a a stairstep graph. The y value is continued constantly from every x position, i.e. the interval [x[i], x[i+1]) has the value y[i].
void PlotStairs(const char* label_id, const T* values, int count, double xscale=1, double x0=0, int offset=0, int stride=sizeof(T));
void PlotStairs(const char* label_id, const T* xs, const T* ys, int count, int offset=0, int stride=sizeof(T));
void PlotStairsG(const char* label_id, ImPlotPoint (*getter)(void* data, int idx), void* data, int count, int offset=0);
|

ImPlotFlags_Equal - (v0.9 - 11/15/2020)Primary X and Y axes can now be constrained to have equal aspect ratios with
|

This issue was moved to a discussion.
You can continue the conversation there. Go to discussion →
Announcements of changes and new features will be posted here. Click
Subscribeto the right to receive updates!PLEASE DO NOT COMMENT ... EMOJIS ARE WELCOME :)
The text was updated successfully, but these errors were encountered: