Profiling and metrics
Here I will detail the profiling results of EPIC's first Bifrost-based iteration. Briefly, the EPIC code creates a pipeline where the data streams move through multiple processing (or Operating) blocks (e.g., `DecimationOp) via ring buffers. Based on the user-specified settings, the EPIC program may produce images up to a bandwidth of 3.3 MHz at all four (XX, YY, XY, YX) polarizations. Each Op-block is run on a separate thread, bound to its own CPU, while the entire process currently utilizes only one of the two available GPUs on the EPIC node at SV. Below I will only describe results pertaining to the GPU and I will post CPU profiling on a separate thread.
Before I show the results, I will describe the tools used. I used NVIDIA Nsight Systems to measure the overall performance (or system-level profiling for the GPU-peeps), and NVIDIA Nsight Compute to measure the kernel metrics. See Pearson (2020) for a nice overview of these tools. For both tools, I ran EPIC with the following options to profile the code with a total runtime of 50 s:
- Gulp size 40 ms (or
--nts 1000) - Single polarization
- Image size 64x64
- Image resolution 1.8 deg
- Accumulation time (80 ms)
- Channels 90
Run command:
LD_PRELOAD="libvma.so" VMA_RX_POLL=1000 VMA_INTERNAL_THREAD_AFFINITY=0 VMA_RX_PREFETCH_BYTES=128\
 VMA_THREAD_MODE=0 VMA_MTU=9000 VMA_TRACELEVEL=0 numactl --cpubind=1 --membind=1\
 ./LWA_bifrost.py  --addr 239.168.40.16 --port 4015 --channels 90\
--imagesize 64 --imageres 1.8 --accumulate 80 --nts 1000 --singlepol --duration 50The imaging takes place in the MOFFCorrelatorOp block, which mostly operates on the GPU. For completeness, I list the other main blocks in the imager in the actual sequence.
- FEngineOp (CPU): This block captures packets from the F-Engines and orders them accordingly.
- DecimationOp (CPU or GPU): The channels may be averaged (GPU) or filtered (CPU) for further processing.
- MoFFCorrelatorOp
- SaveOp (CPU): Formats and saves the images to disk or PostgresDB
Following is a brief outline of the sequence of operations that are carried out in this block. The typical processing times for a 40 ms gulp are provided in the square brackets. I will introduce autocorrelation removal in a different profiling run.
- Memset the cross-multiplied data to 0 (once for each image)
Loop until accumulation>=80 ms
 - Load antenna (or un-gridded) data                       [1.9  ms]
 - Memset the gridded data to 0                            [5.0  ms]
 - Grid the data (VGrid kernel)                            [2.7  ms]
 - Inverse FFT the gridded data (vec_2d_fft kernel)        [11.0 ms]
 - Cross multiply (XGrid kernel)                           [16.6 ms]
- Combine all images in the gulp (reduce kernel)           [5.0  ms]
-                                              Total time: [42.2 ms]
The final image has dimensions of [2 (real, complex), npol, nchan, grid_size, grid_size].
Below is a screenshot from the Nsight systems UI. The data is available in the profiling/systems folder of the repo. See the user guide for information on how to interpret the data.
Notice the ~4 ms gap between reduce kernel and
D2Hcopy of the reduced image. I'm unsure what is causing this, but I presume it is the time required to acquire a lock on the output ring buffer, which is an input to theSaveOpblock. Although it could be a gap introduced by the profiler, it is unlikely for the gap to consistently exist only between the reduce and the copy steps.
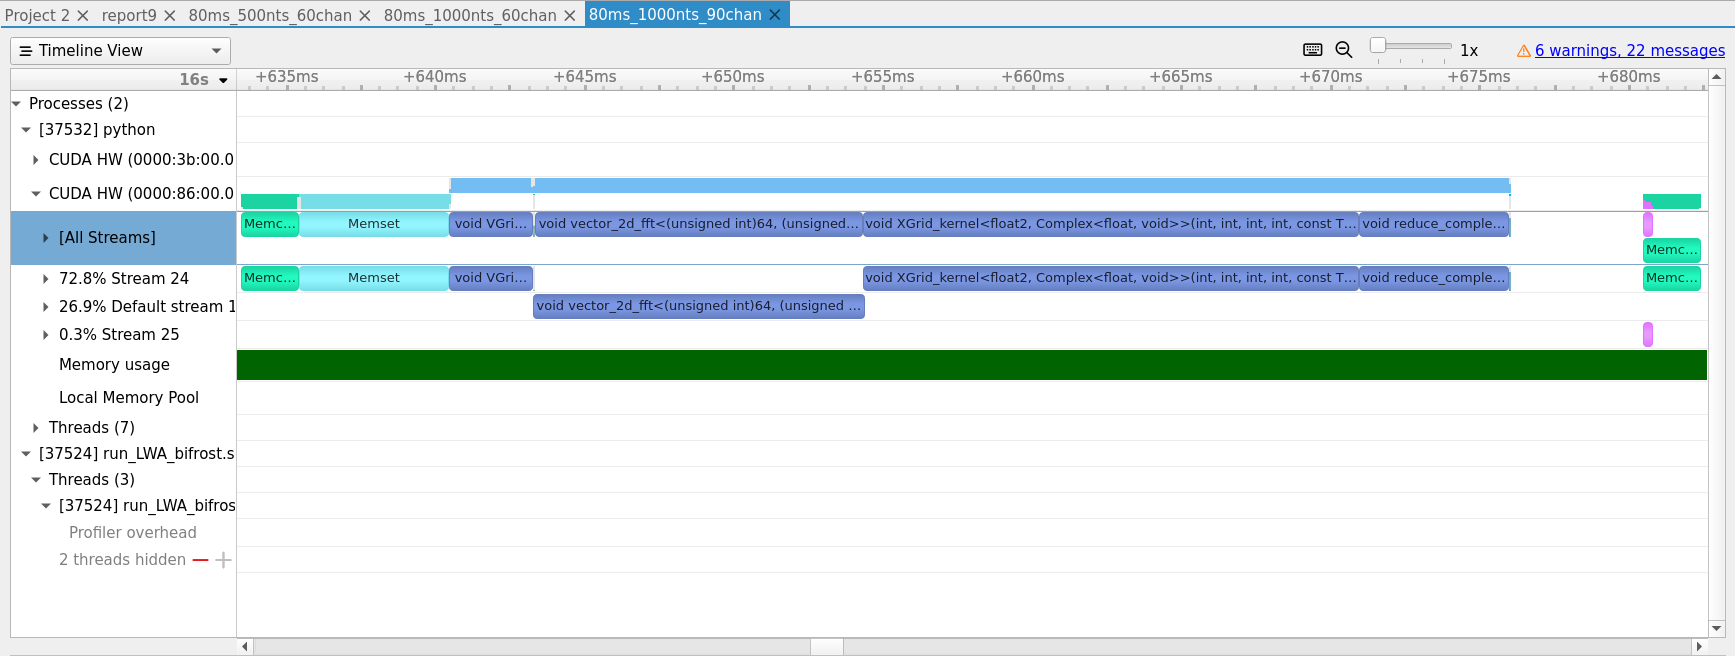
Although the FFT kernel runs in a different stream than VGrid and XGrid, they do not overlap. To see if there is any room for improvement, let's take a look at the profiling results from the Nsight Compute. I used the same options provided above to run the EPIC imager. See Subrahmaniam (2021) for a nice lecture on how to use Nsight Systems and Compute to optimize kernels.