Hello,
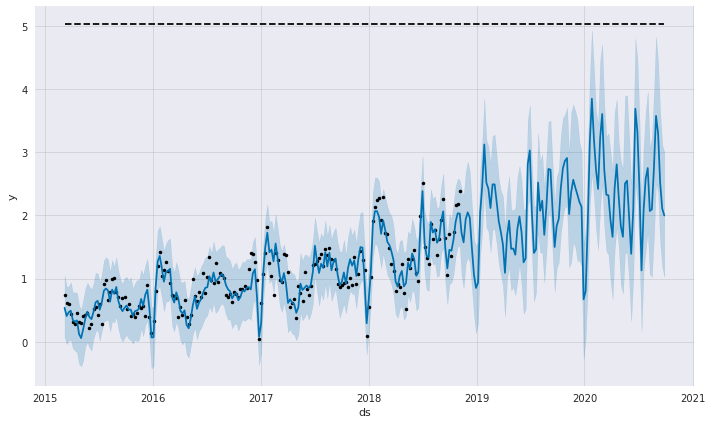
I would expect the yhat lower/upper values to increase with the forecasting horizon, e.g. larger uncertainty in forecasting further out in time. However, the spread seem equidistant, like so:
I've seen similar behaviour to this in examples online, eg. in this figure
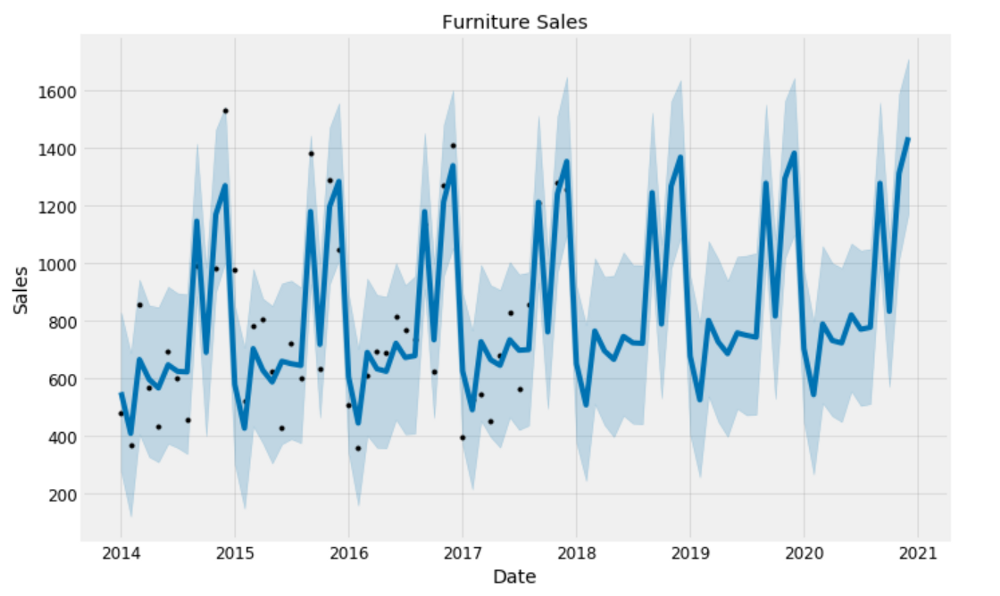
from https://towardsdatascience.com/an-end-to-end-project-on-time-series-analysis-and-forecasting-with-python-4835e6bf050b
And I see the same behaviour with trying out different horizons (e.g. one year forward from 3 years of data).
Is this expected behaviour?
How would one account for a (what I guess is a rightful assumption) increase in uncertainty with larger forecasting horizons?
Hello,
I would expect the yhat lower/upper values to increase with the forecasting horizon, e.g. larger uncertainty in forecasting further out in time. However, the spread seem equidistant, like so:

I've seen similar behaviour to this in examples online, eg. in this figure

from https://towardsdatascience.com/an-end-to-end-project-on-time-series-analysis-and-forecasting-with-python-4835e6bf050b
And I see the same behaviour with trying out different horizons (e.g. one year forward from 3 years of data).
Is this expected behaviour?
How would one account for a (what I guess is a rightful assumption) increase in uncertainty with larger forecasting horizons?