In this project I'll try to analysis one year sales data using python in jupyert notebook including the visualization. You can also check my jupyter notebook file 221122_Sales_Analysis_Project - Jupyter Notebook.pdf in this repository because I also put comments and markdowns for each steps to help understad the process of this project.
lets start by importing necessary libraries. After that, because the sales data is separated in each month, we need to merging this data into one single sheet.
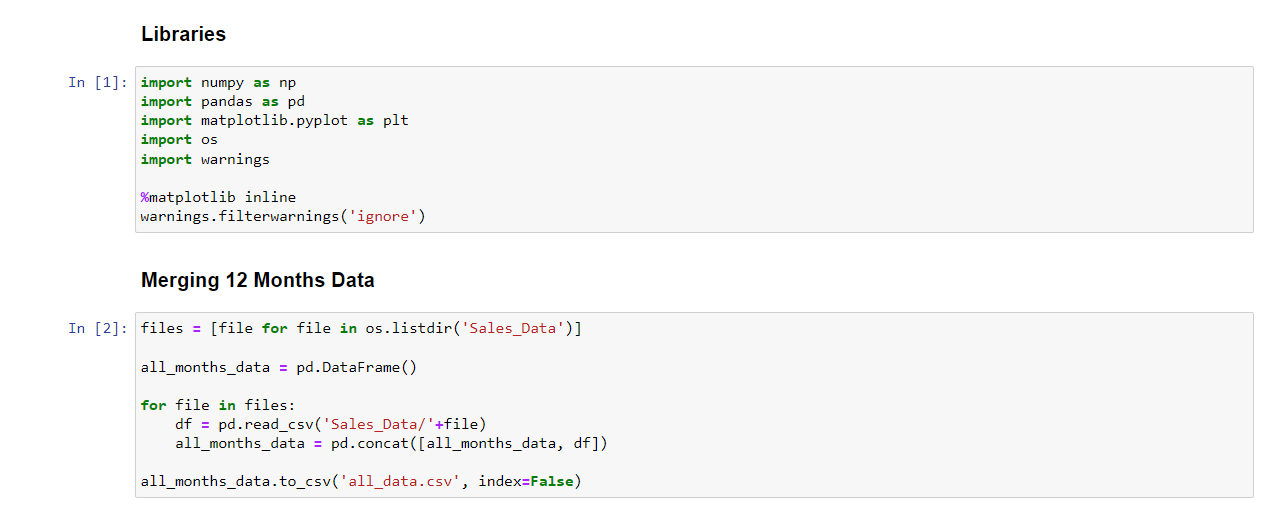 Now we have merged data in all_data.csv. Lets continue to data cleaning!
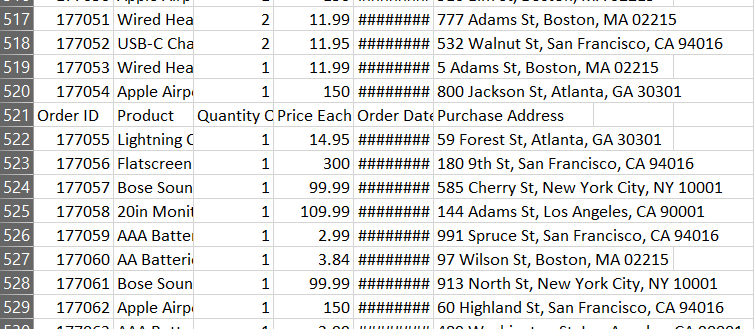
As you can see below when I check the merged data, this data is not perfectly merged as desired. There is some null rows and some column headers is interpreted as data.
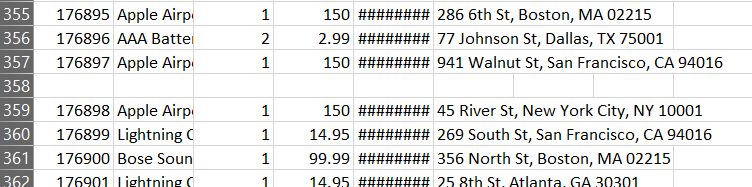
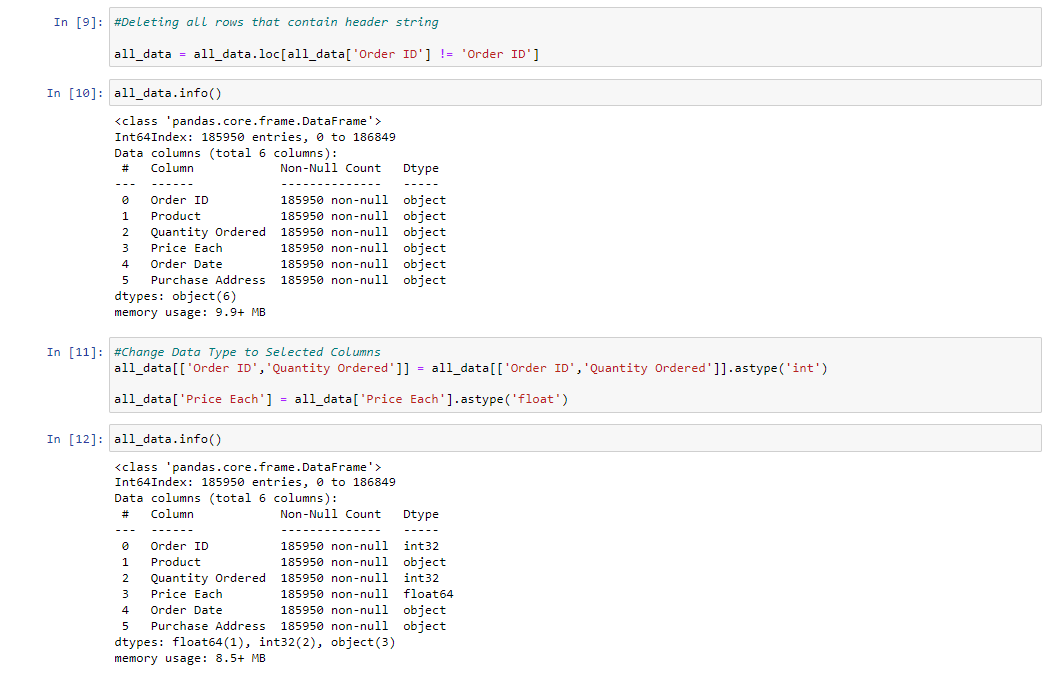
So we know what is need to be done, let's drop the rows that contain null and column headers, then change the numerical data type to int.

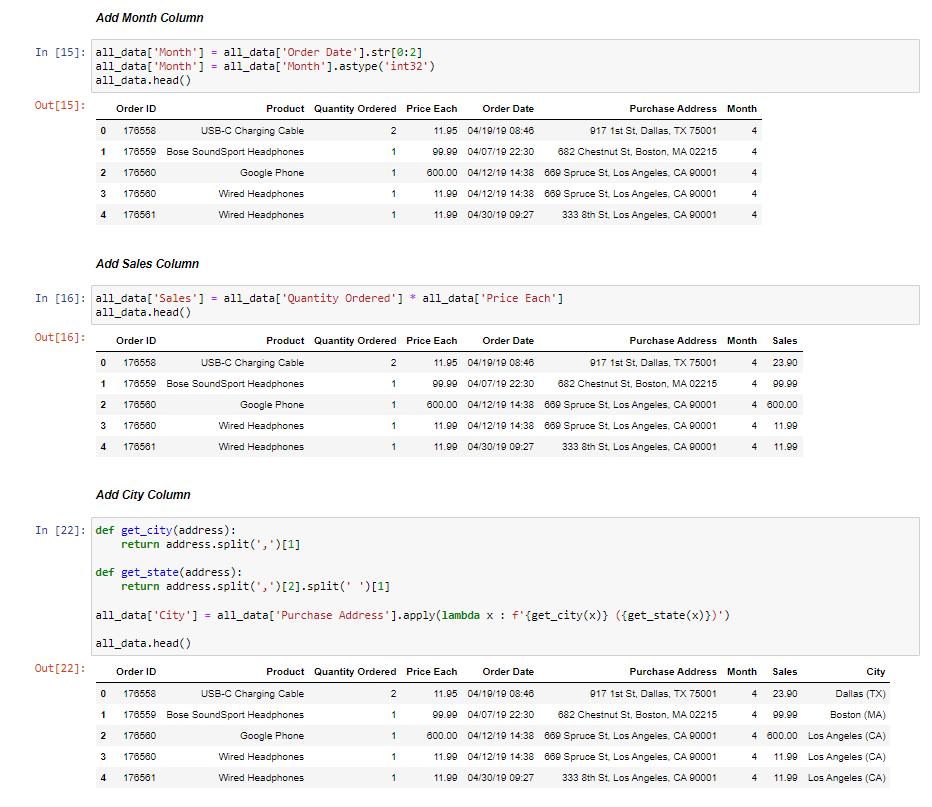
Before start to analysis, we need to adding some columns such as Month Number, Sales and City Name
Data analysis in term of business always related to the business question. So my analysis is based on business question that the answer can help give the business insight.
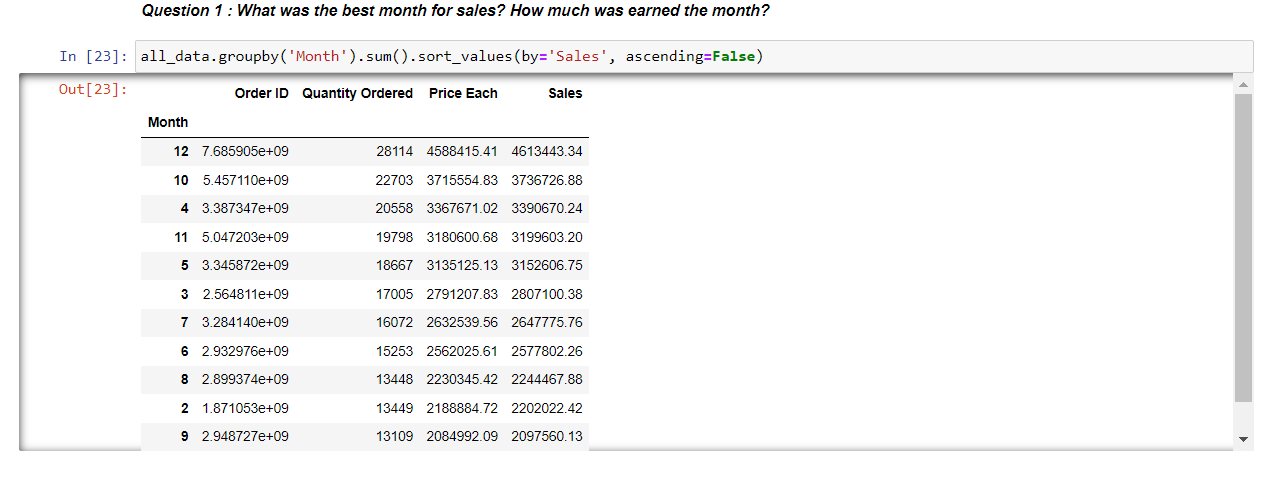
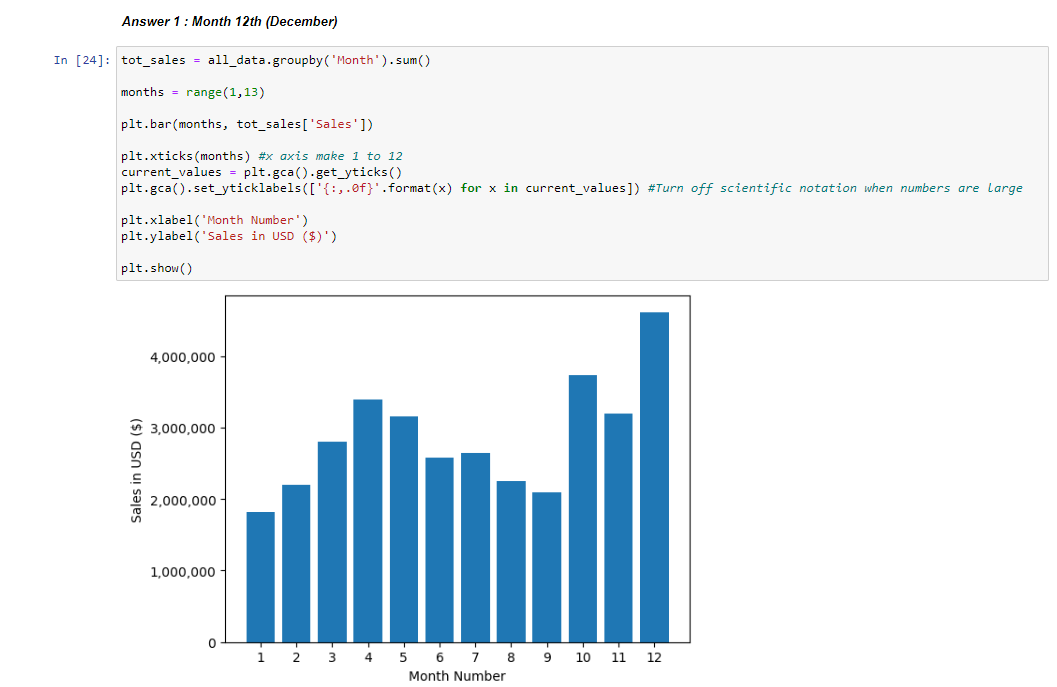 From the analysis above we have the insight of the best month for sales is December. Maybe it is related to Christmas and New Year so sales can increase.
What about the best city for sales?
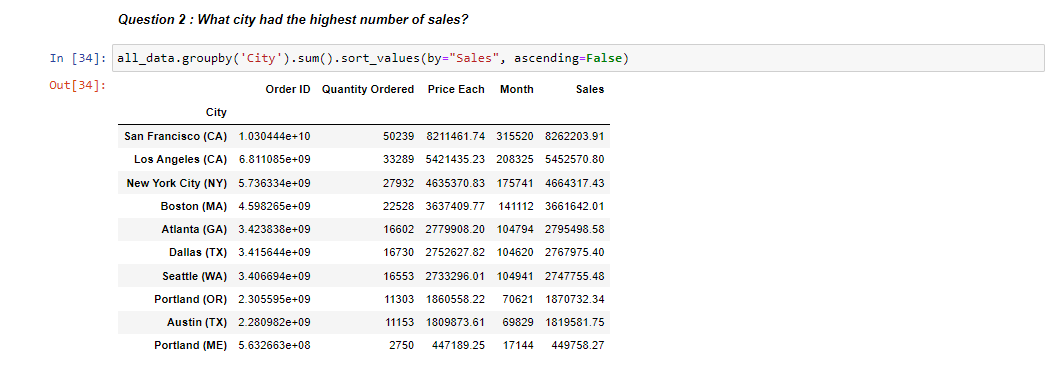
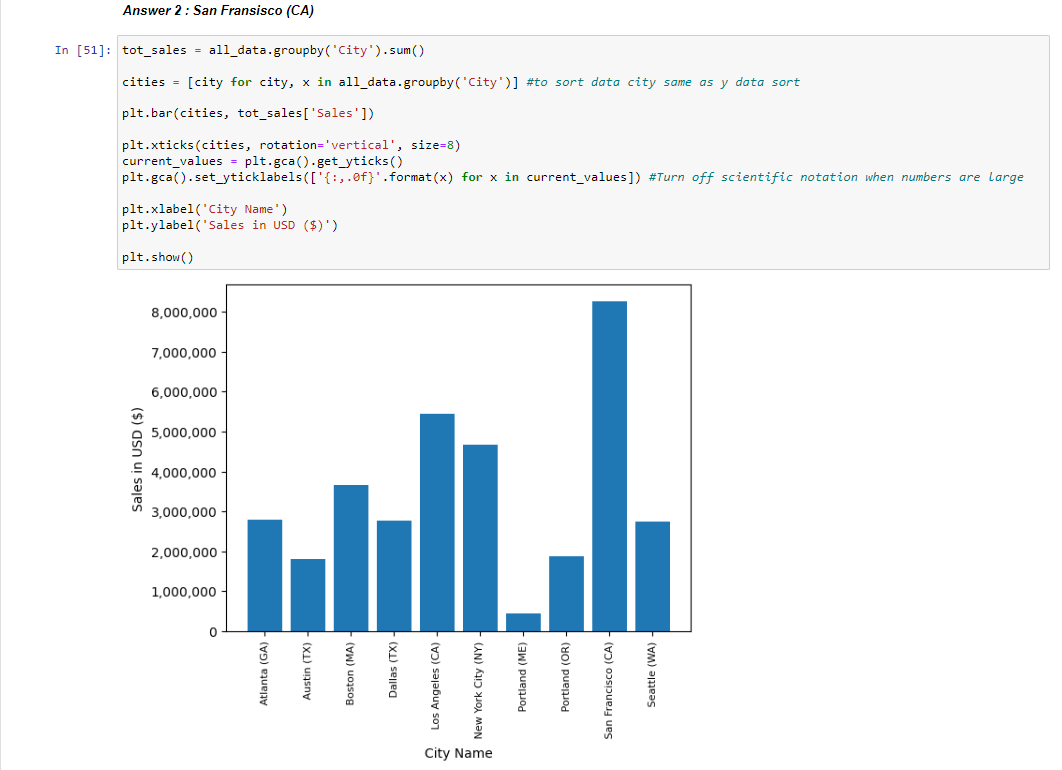 We now answer the question that based on data San Francisco is the best city for sales.
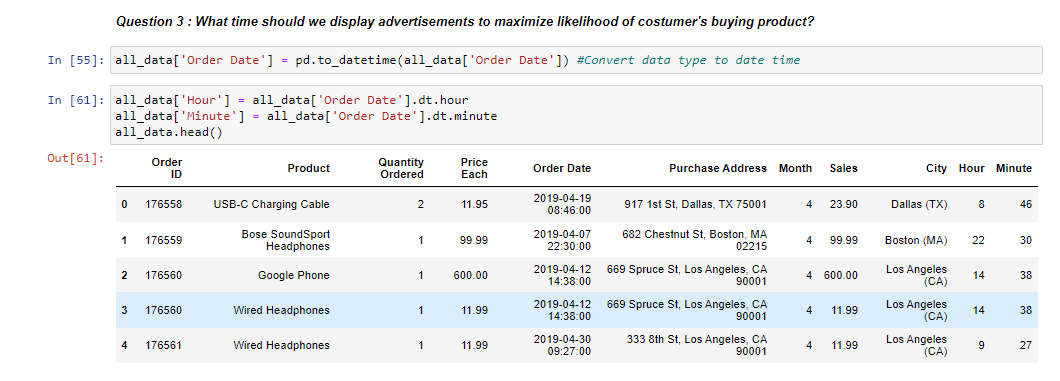
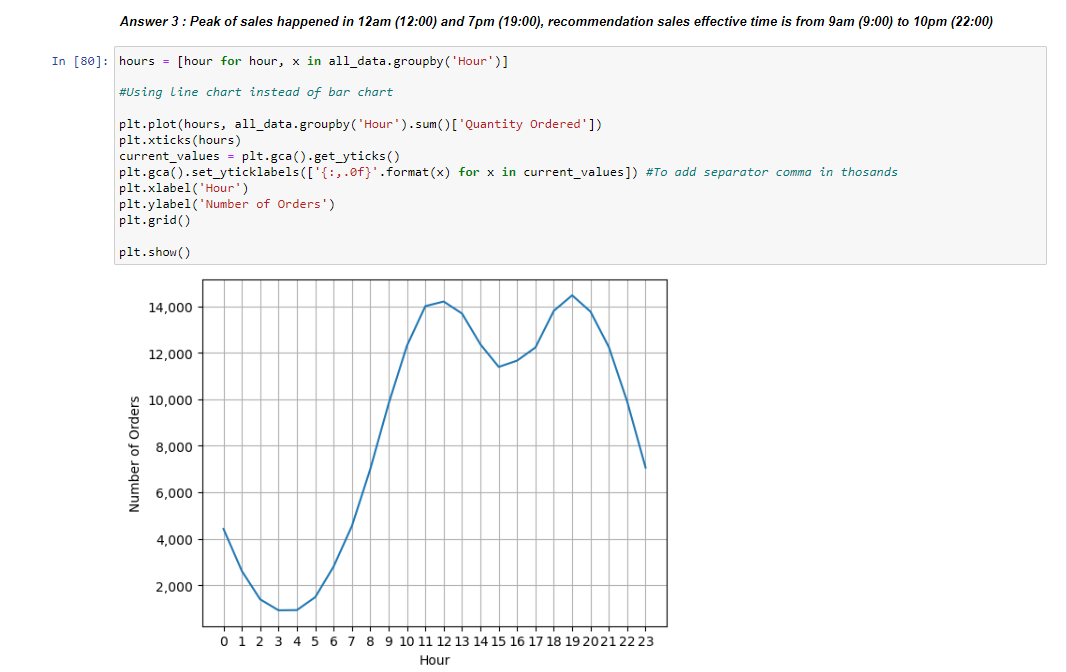
Now lets find out what time is the peak of sales?
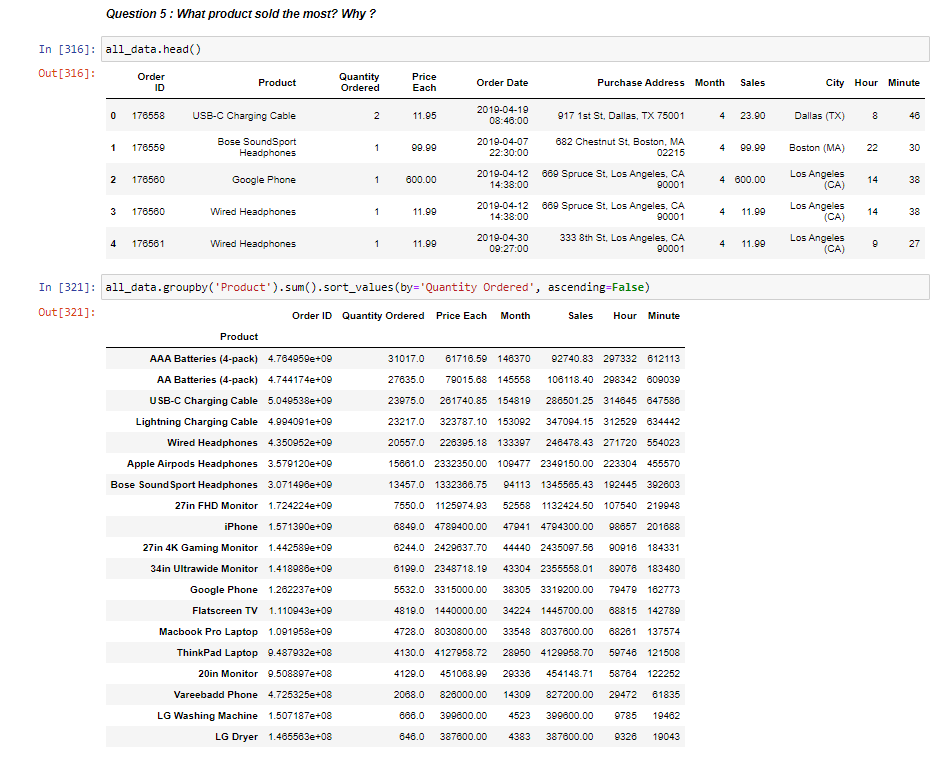
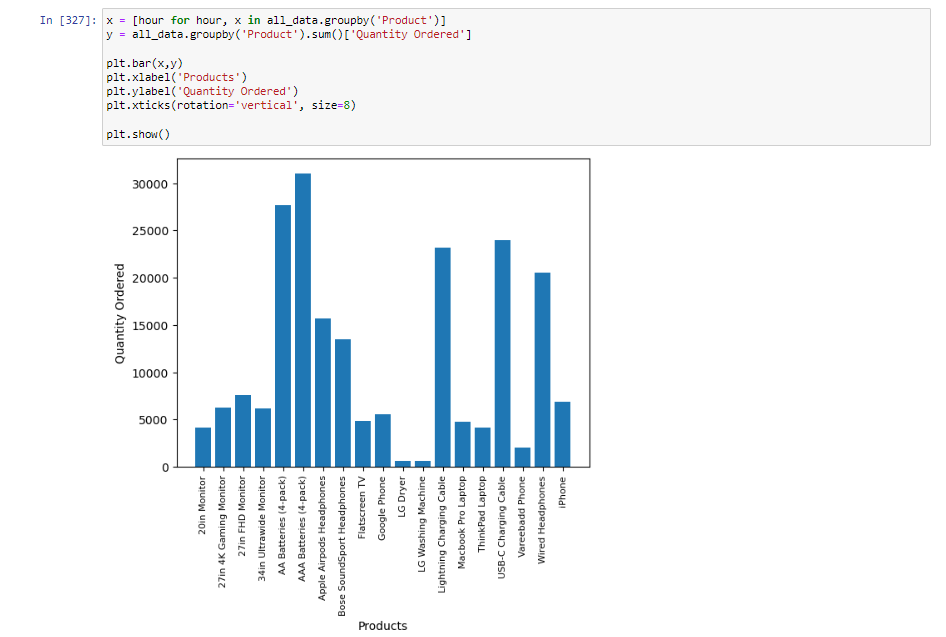
What about most sales product?