Future Roadmap
Signal's roadmap is organized around two distinct concerns: the intelligence synthesis layer and the supporting infrastructure beneath it.
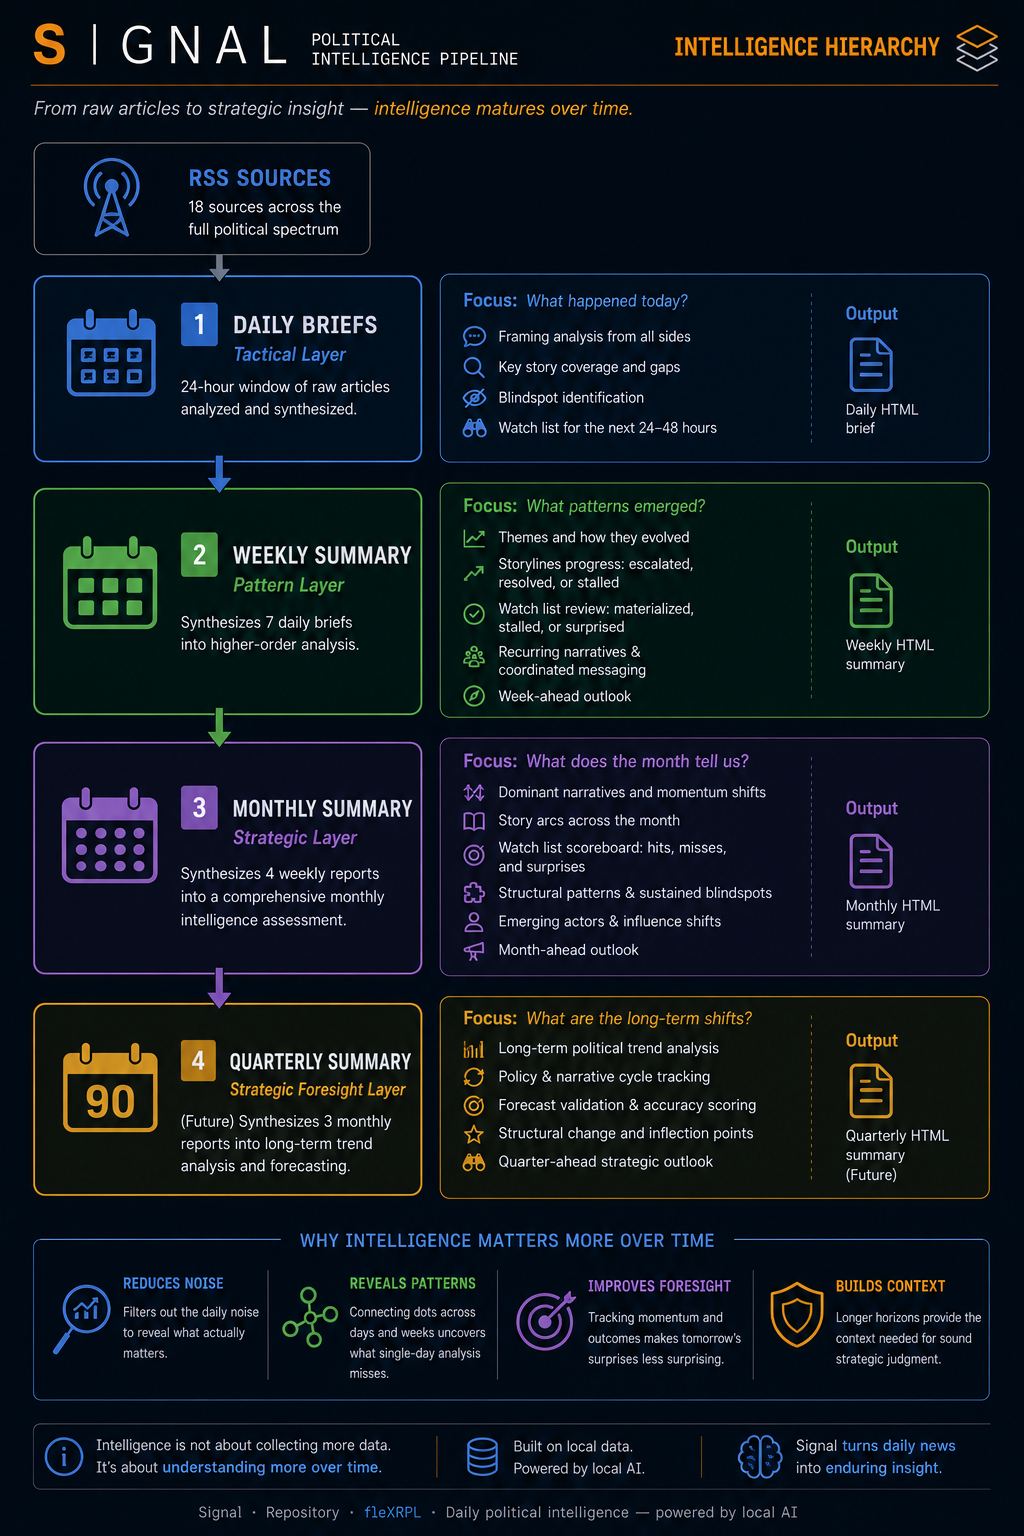
The core value of Signal is not the pipeline — it is the longitudinal reduction of noise into insight. Each synthesis pass operates at a longer time horizon and produces analysis that is only possible because of the layer below it:
Raw articles   →  Daily brief       (tactical signals)
Daily briefs   →  Weekly report     (emerging patterns)
Weekly reports →  Monthly report    (strategic shifts)      ← Phase 3
Monthly reports → Quarterly report  (structural trends)     ← future horizon
This mirrors how actual intelligence organizations reduce noise. The monthly and quarterly layers are not simply "summaries of summaries" — they enable analysis that is structurally impossible at shorter time horizons: narrative momentum tracking, forecast validation, persistent blindspot detection, and cross-cycle trend emergence.
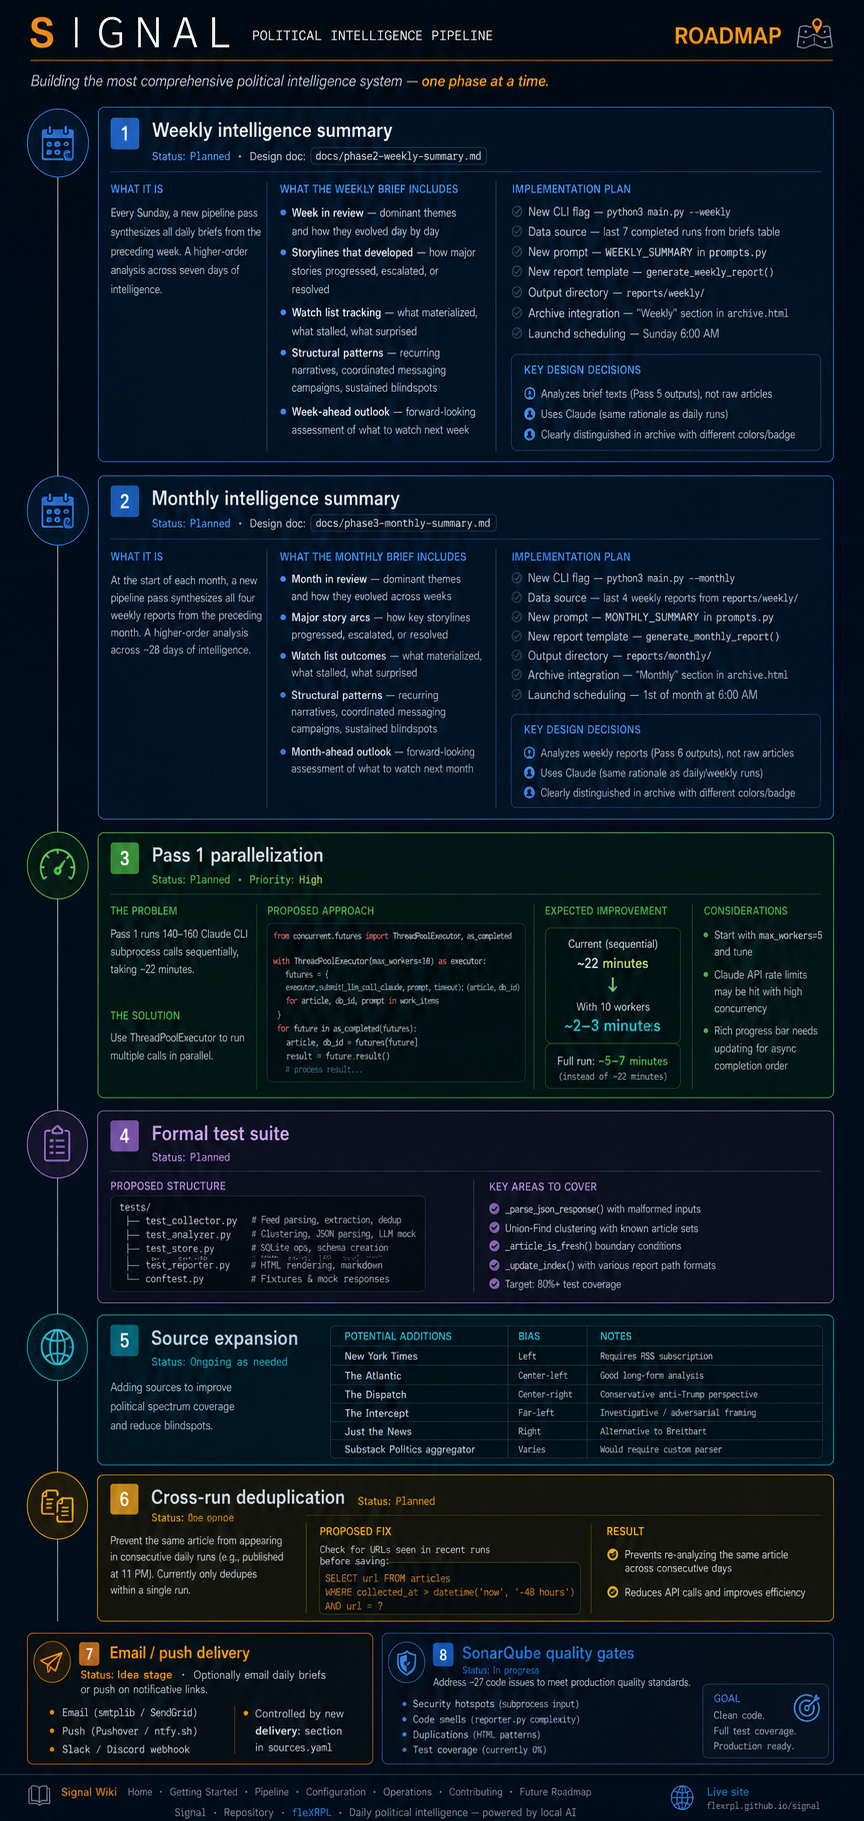
Everything else — SonarQube cleanup, source expansion, cross-run deduplication, delivery — supports the synthesis layer but does not define it.
Status: ✅ Complete (May 2026). See Weekly-Reports for full documentation.
Every Monday at 6:00 AM, a separate launchd job runs the weekly synthesis pipeline (Pass 6). It reads the past 7 days of daily briefs and correlation analyses from signal.db and makes a single LLM call to produce a weekly intelligence brief.
The weekly brief contains:
- Week in Review — the dominant political dynamic of the week as a whole
- Story Arc Tracker — how the top 3–5 stories evolved day by day
- What Escalated — items that grew in significance as the week progressed
- What Was Buried — stories that appeared then disappeared without resolution
- Blindspot of the Week — the most significant story both sides systematically underreported
- Watch List: Next Week — concrete forward-looking items with named entities and deadlines
- Analyst Note — a weekly assessment of trajectory
-
Read from DB, not HTML files — the structured JSON in
correlation_analysesandcluster_analysesis richer than re-parsing HTML. Each day'sSITUATION OVERVIEW,WATCH LIST, narrative patterns, and anomalies are extracted and fed to Pass 6. - Single LLM call — unlike daily Pass 1 (one call per article), the weekly synthesis is one large-context call. Claude handles this well; Ollama would struggle with the context window.
-
Gold/amber visual identity — weekly reports use a gold accent scheme (
#e3b341) instead of the daily blue, making them immediately distinguishable in the archive and on the landing page. -
Separate
weekly_briefsDB table — weekly runs never interfere with daily data. - Schedule: Monday 6:00 AM — runs after the 4 AM daily completes, when the Mac is reliably awake, capturing the full week including weekend news.
| File | Purpose |
|---|---|
pipeline/weekly.py |
Pass 6 — reads DB, formats daily summaries, calls LLM |
scripts/run_weekly_and_publish.sh |
Shell wrapper: runs weekly pipeline + git push |
scripts/com.flexrpl.signal.weekly.plist |
launchd configuration for Monday 6:00 AM |
Status: ✅ Complete (MVP, June 2026). See Monthly-Reports for full documentation.
On the 1st of each month at 7:00 AM, a launchd job runs the monthly synthesis pipeline (Pass 7). It reads daily briefs and weekly summaries for the previous calendar month from signal.db and makes a single LLM call. Partial months (e.g. pipeline started mid-month) are auto-detected and labeled.
The monthly brief contains:
- Month in Review — the dominant political dynamic of the month as a whole
- Story Arc Tracker — how the top stories evolved across weeks
- Watch List Scorecard — accountability on what was flagged vs. what materialized
- Coverage Pattern Analysis — recurring blindspots that persisted all month
- Emerging Actors — people and institutions that gained significance
- Watch List: Next Month — concrete forward-looking items
- Analyst Note — monthly trajectory assessment
-
Daily + weekly inputs — reads both
briefs/correlation_analysesandweekly_briefs, not weekly summaries alone - Single LLM call — one large-context Claude call, same pattern as Pass 6
-
Purple visual identity — monthly reports use purple accent (
#a371f7), distinct from daily blue and weekly gold - Partial month support — filename and header badge when coverage does not span the full calendar month
-
Separate
monthly_briefsDB table — monthly runs never interfere with daily or weekly data - Schedule: 1st of month, 7:00 AM — runs after daily (4 AM) and weekly (Mon 6 AM)
| File | Purpose |
|---|---|
pipeline/monthly.py |
Pass 7 — reads DB, formats summaries, calls LLM |
scripts/run_monthly_and_publish.sh |
Shell wrapper: runs monthly pipeline + git push |
scripts/com.flexrpl.signal.monthly.plist |
launchd configuration for 1st of month, 7:00 AM |
tests/test_monthly.py |
Unit tests for Pass 7 (mocked LLM) |
First production monthly: May 2026 partial (manual run, May 11–31). First scheduled full monthly: July 1, 2026 (June 2026 data).
Status: Future horizon. Not planned for active development until Phase 3 is stable and at least two months of monthly reports exist.
Quarterly is where genuine political trend analysis begins to emerge rather than news analysis. A quarter of data — ~90 daily briefs, ~13 weekly reports, ~3 monthly reports — is long enough to detect structural shifts in the political landscape that are invisible at shorter time horizons.
Unique quarterly analytical outputs would include:
- Structural Shift Detection — which political dynamics fundamentally changed vs. which only appeared to change
- Narrative Lifecycle Analysis — full arc from emergence to resolution or institutionalization for major stories
- Actor Trajectory Index — which people and organizations rose, fell, or consolidated influence over 90 days
- Seasonal Pattern Recognition — distinguishing genuine political shifts from recurring seasonal news cycles
- Forecast Accuracy Review — evaluate monthly Forecast Scorecards against outcomes; a meta-level assessment of intelligence quality
The quarterly layer also enables something the shorter layers cannot: retrospective correction. A monthly event that looked significant at the time can be re-evaluated at 90 days with the benefit of what happened next.
Status: Deferred. Not necessary for current usage — the daily run completes well before the 4:00 AM window closes.
Current: Pass 1 runs 140–160 Claude CLI subprocess calls sequentially, taking ~22 minutes.
Proposed: Use concurrent.futures.ThreadPoolExecutor to run multiple calls in parallel:
from concurrent.futures import ThreadPoolExecutor, as_completed

with ThreadPoolExecutor(max_workers=10) as executor:
    futures = {
        executor.submit(_llm_call_claude, prompt, timeout): (article, db_id)
        for article, db_id, prompt in work_items
    }
    for future in as_completed(futures):
        article, db_id = futures[future]
        result = future.result()
        # process result...
Expected improvement: 10 workers × ~9 sec/call = Pass 1 completes in ~2–3 minutes instead of ~22. Full run time drops from 22 minutes to ~5–7 minutes.
Considerations:
- Claude API rate limits — Anthropic's API allows high concurrency on Pro/Max plans, but sustained 10-parallel subprocess calls may hit limits. Start with
max_workers=5and tune. - The Rich progress bar needs updating to work with async completion order.
Status: ✅ Complete (June 2026). See Testing for full documentation.
239 tests across all pipeline modules. ~93% overall coverage. analyzer.py at 100%. All LLM calls and network I/O are mocked — the suite runs in under two minutes.
Status: ✅ Complete (May 2026). See Social-Cards for full documentation.
Three infographic cards are generated each morning from brief_data.json and posted to Bluesky on a launchd schedule: Watch List at 9:00 AM, Spectrum Breakdown at noon, Blindspot Analysis at 6:00 PM. Cards render at 1200×630px via Playwright headless Chromium. Post packages are pre-generated at 4:00 AM so the posting jobs do no model or rendering work at post time.
Files added: pipeline/infographic.py, pipeline/social.py, pipeline/templates/ (3 card templates), post_scheduled.py, 3 launchd plists in scripts/, .env.example. pipeline/reporter.py updated to write brief_data.json.
Status: ✅ Complete (May 2026)
feed.xml is generated at the repo root on every pipeline run (daily and weekly) and served via GitHub Pages at https://flexrpl.github.io/signal/feed.xml. The feed contains up to 30 items combining daily and weekly reports in reverse chronological order.
Subscribe in any RSS reader using: https://flexrpl.github.io/signal/feed.xml
Files added: pipeline/feed.py, tests/test_feed.py
Status: Ongoing as needed
Potential additions to improve spectrum coverage:
| Source | Bias | Notes |
|---|---|---|
| New York Times | left | Requires RSS subscription |
| The Atlantic | center-left | Good long-form analysis |
| The Dispatch | center-right | Conservative anti-Trump perspective |
| The Intercept | far-left | Investigative/adversarial framing |
| Just the News | right | Alternative to Breitbart |
| Substack Politics aggregator | varies | Would require custom parser |
Status: Planned
Currently, if an article is published at 11 PM, it may appear in both the Day 1 run (within the 24-hour window) and the Day 2 run (still within the window at 4 AM). URL deduplication is only within-run.
Proposed fix: Before saving articles in store.py, query for URLs already seen in recent runs:
SELECT url FROM articles
WHERE collected_at > datetime('now', '-48 hours')
AND url = ?
This would prevent re-analyzing the same article across consecutive days.
Status: Idea stage
Instead of only publishing to GitHub Pages, optionally email the daily brief to a subscriber list or push a notification with the report link.
Options:
-
Email: Send the HTML report via
smtplibor a service like SendGrid - Push notification: Use a service like Pushover or ntfy.sh
- Slack/Discord webhook: Post a summary and link to a channel
This would be controlled by a new delivery: section in sources.yaml.
Status: In progress
Remaining issues are cognitive complexity warnings in reporter.py and main.py — primarily due to the large HTML template functions. Test coverage is no longer a blocker (~93% overall). Key remaining categories:
-
Code smells — overly complex functions in
reporter.py(_render_story_cards,_render_brief_sections) and_update_index()inmain.py - Duplications — repeated HTML generation patterns across daily and weekly templates