Describe the bug
I have a setup with 28 nodes and fluentbit as log collector from docker for each node with kubernetes, sometimes (I don't know when) one pod (always a different one) has a unrealistic amount of log reported via the prometheus metric fluentd_output_status_num_records_total. This leads to a buffer overflow on fluentd side, if I check Elasticsearch the pod with the high log volume looks completely normal (log volume as expected).
To Reproduce
Happens sometimes, and I don't even know what todo to fix it.
Expected behavior
Not run into a buffer overflow, and not create "imaginary" traffic
Your Environment
- Fluentd or td-agent version: td-agent 3.8.0
- Operating system: Centos 7
- Kernel version: 5.4.60
Your Configuration
<source>
  @type forward
  @label @forwarding
  bind 0.0.0.0
  port 24224
</source>

<source>
  @type monitor_agent
  bind 0.0.0.0
  port 24220
</source>

<source>
  @type prometheus
  bind 0.0.0.0
  port 24231
</source>

<source>
  @type prometheus_monitor
  interval 10
  <labels>
    hostname ${hostname}
  </labels>
</source>

<source>
  @type prometheus_output_monitor
  interval 10
  <labels>
    hostname ${hostname}
  </labels>
</source>


<label @FLUENT_LOG>
  @type null
</label>

<label @forwarding>
  <match **>
    @type copy

    <store>
      @type elasticsearch
      hosts open-es-masters.logging.svc.cluster.local.
      port 9200
      reload_on_failure true
      logstash_format true
      logstash_prefix kubernetes
      flush_interval 3s
      request_timeout 60s
      user kubernetes-ingest
      password {redacted}
      log_es_400_reason true
    </store>


    <store>
      @type flowcounter
      @id out_flowcount
      @label @counts
      count_keys *
      unit       second
      aggregate  all
      tag        tdagent.traffic
      #timestamp_counting true
    </store>

    <store>
      @type prometheus
      <metric>
        name fluentd_output_status_num_records_total
        type counter
        desc The total number of outgoing records
        <labels>
          tag ${tag}
          hostname ${hostname}
        </labels>
      </metric>
    </store>
  </match>
</label>

<label @counts>
  <match tdagent.traffic>
    @type prometheus
    <metric>
       name fluentd_flowcount_bytes
       type gauge
       desc Test for flowcount_bytes
       key bytes
       <labels>
         tag ${tag}
         hostname ${hostname}
       </labels>
    </metric>
    <metric>
      name fluentd_flowcount_byterate
      type gauge
      desc Test for flowcount_byterate
      key bytes_rate
      <labels>
         tag ${tag}
         hostname ${hostname}
      </labels>
    </metric>
    <metric>
      name fluentd_flowcount_messagecount
      type counter
      desc Test for flowcount_messagecount
      key count
      <labels>
         tag ${tag}
         hostname ${hostname}
      </labels>
    </metric>
    <metric>
      name fluentd_flowcount_messagecountrate
      type gauge
      desc Test for flowcount_messagecountrate
      key count_rate
      <labels>
         tag ${tag}
         hostname ${hostname}
      </labels>
    </metric>
    <metric>
      name fluentd_input_status_num_records_total
      type counter
      desc The total number of incoming records
      <labels>
         tag ${tag}
         hostname ${hostname}
      </labels>
    </metric>
  </match>
</label>
Your Error Log
Basically the buffer is overflowing, even though I can easily follow the TCP packets sent by fluentbit,
2020-11-22 19:57:17 +0000 [warn]: #0 emit transaction failed: error_class=Fluent::Plugin::Buffer::BufferOverflowError error="buffer space has too many data" location="/opt/td-agent/embedded/lib/ruby/gems/2.4.0/gems/fluentd-1.11.1/lib/fluent/plugin/buffer.rb:277:in `write'" tag="kubernetes.var.log.containers.xxx-nginx-85dbf99877-7vzvp_xxx_nginx-e713d94832e2f96767fa6ee694ae4154e7146152f2f948f8f03aeb5076ddfeaf.log"
  2020-11-22 19:57:17 +0000 [warn]: #0 suppressed same stacktrace
2020-11-22 19:57:17 +0000 [error]: #0 unexpected error on reading data host="10.253.40.219" port=51168 error_class=Fluent::Plugin::Buffer::BufferOverflowError error="buffer space has too many data"
  2020-11-22 19:57:17 +0000 [error]: #0 suppressed same stacktrace
Additional context
As you can see in the screenshot there's a sudden high number of messages per tag, which do not correspond to the actual logs generated by docker. (I checked the files)
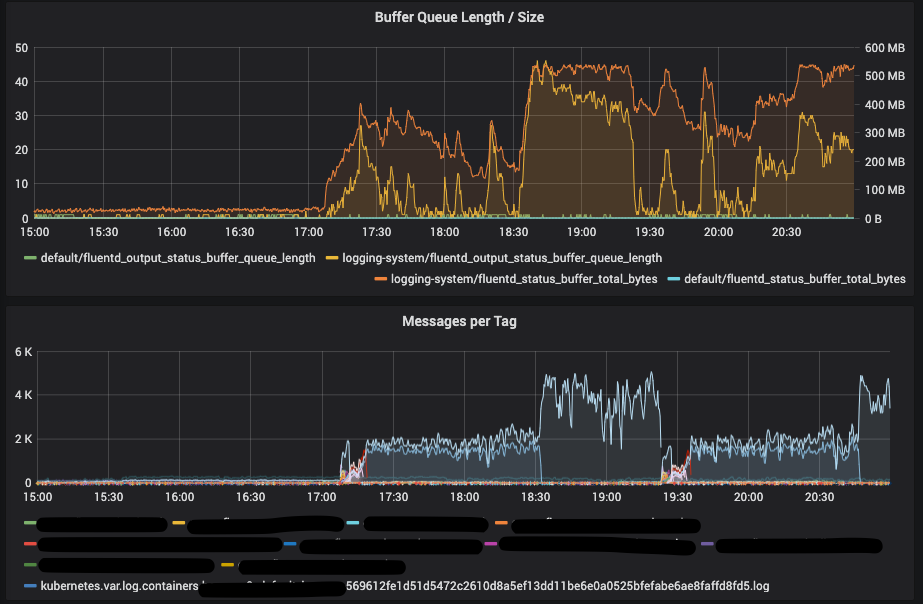
Edit: a restart of all fluentbit agents solved the issue, is there any metrics to figure it out?
Describe the bug
I have a setup with 28 nodes and fluentbit as log collector from docker for each node with kubernetes, sometimes (I don't know when) one pod (always a different one) has a unrealistic amount of log reported via the prometheus metric fluentd_output_status_num_records_total. This leads to a buffer overflow on fluentd side, if I check Elasticsearch the pod with the high log volume looks completely normal (log volume as expected).
To Reproduce
Happens sometimes, and I don't even know what todo to fix it.
Expected behavior
Not run into a buffer overflow, and not create "imaginary" traffic
Your Environment
Your Configuration
Your Error Log
Basically the buffer is overflowing, even though I can easily follow the TCP packets sent by fluentbit,
Additional context
As you can see in the screenshot there's a sudden high number of messages per tag, which do not correspond to the actual logs generated by docker. (I checked the files)
Edit: a restart of all fluentbit agents solved the issue, is there any metrics to figure it out?