Source is not displayed in Timeline when profiling app #2391
Description
I am executing a flutter app in profile mode using the following VS Code config:^
{
            "name": "Profile App",
            "program": "lib/main.dart",
            "request": "launch",
            "type": "dart",
            "flutterMode": "profile"
}
Then, when having a look at the Timeline in Dart DevTools, I unfortunately do not see the source:
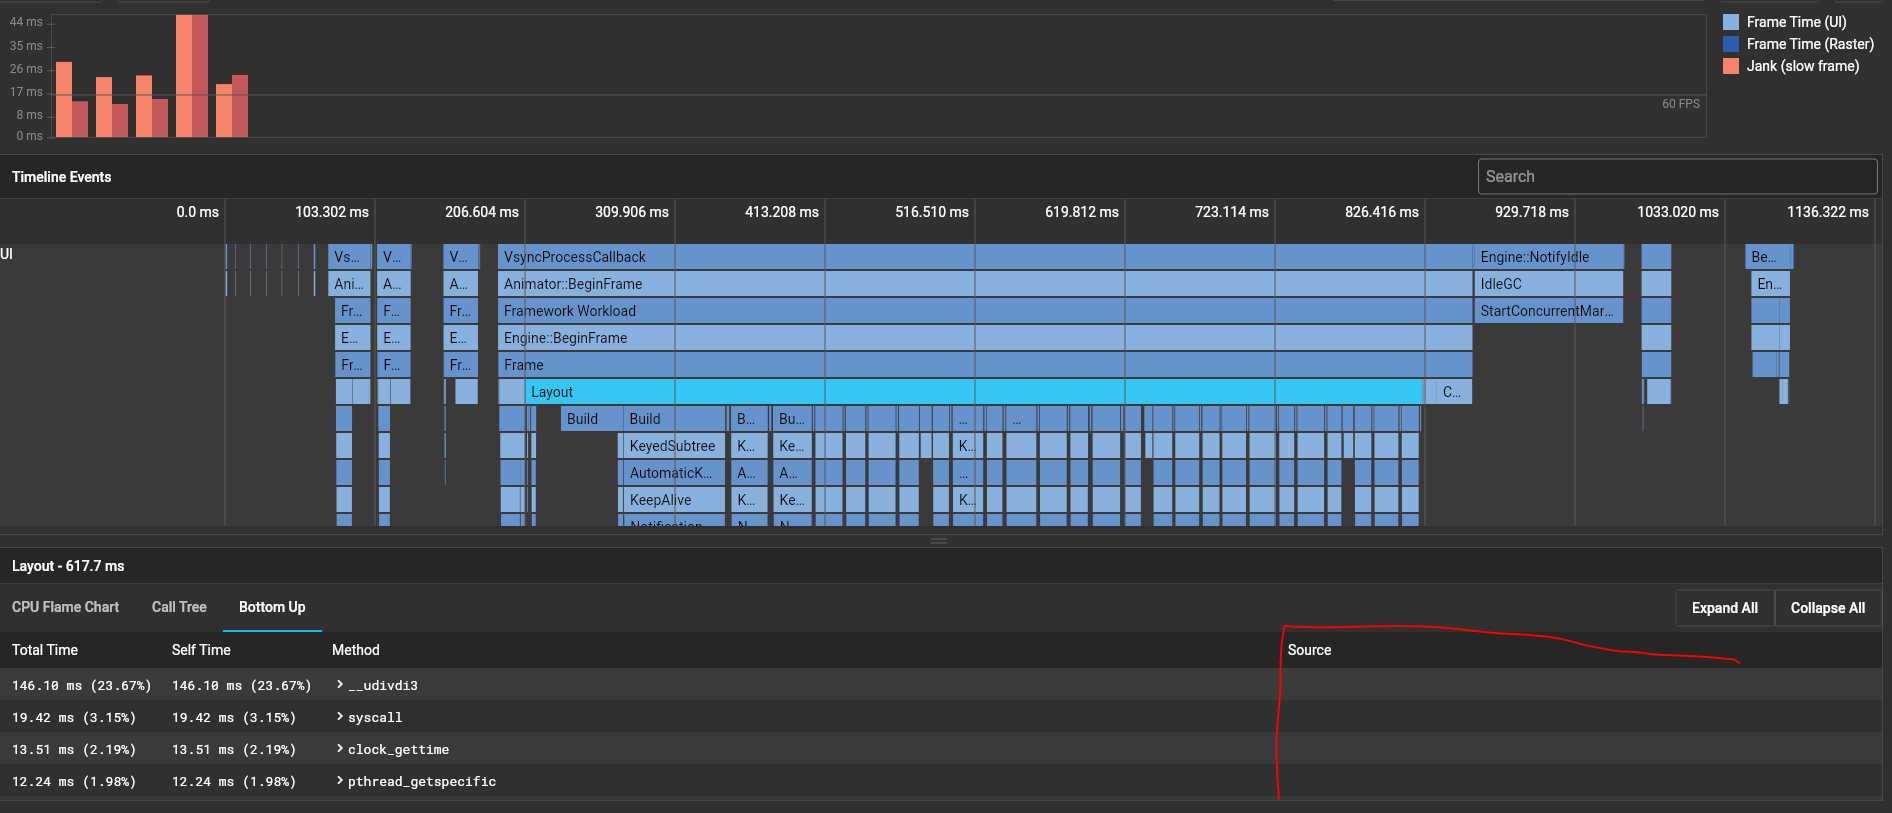
It's empty for the complete stack and it's empty in the browser as well as in the embedded VS Code view.
I'm actually not sure if the app is executed correctly in profile mode as it seems I cannot see any of my own code in the stack. But this could also be because I am not yet very experienced in using the profiler in DevTools. I just execute the app using the above mentioned profile launch config and then open the DevTools/Timeline, make some action in the app and then click refresh.
Versions are the following:
- Device info from DevTools:

- Doctor summary (to see all details, run flutter doctor -v):
[√] Flutter (Channel stable, 1.20.4, on Microsoft Windows [Version 10.0.18363.1082], locale de-DE)
[√] Android toolchain - develop for Android devices (Android SDK version 29.0.2)
[√] Android Studio (version 4.0)
[√] VS Code (version 1.49.2)
[√] Connected device (2 available) - DevTools version 0.9.2