Super New to pycortex #382
Description
Hi there,
I'm to new to pycortex, but your tool seems super useful.
I run simulations on a 30 areas model (V1, V2, V4, DP, MT, 8m, 5, 8l, 2, TEO, F1, STPc, 7A, 46d, 10, 9/46v, 9/46d, F5, TEpd, PBr, 7m, LIP, F2, 7B, ProM, STPi, F7, 8B, STPr and 24c) and I get the firing rate of each of them all along.
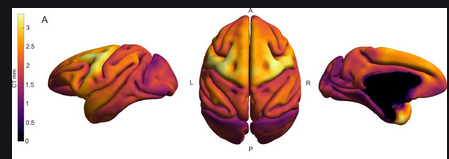
I'd like to have a nice way of plotting snapshots of it. Like turning a (30,) numpy array into the following image:
https://ars.els-cdn.com/content/image/1-s2.0-S1053811920311563-gr10.jpg
I couldn't find any documentation explaining it, but I'm eager to learn how to use your tool!
Thanks a lot,