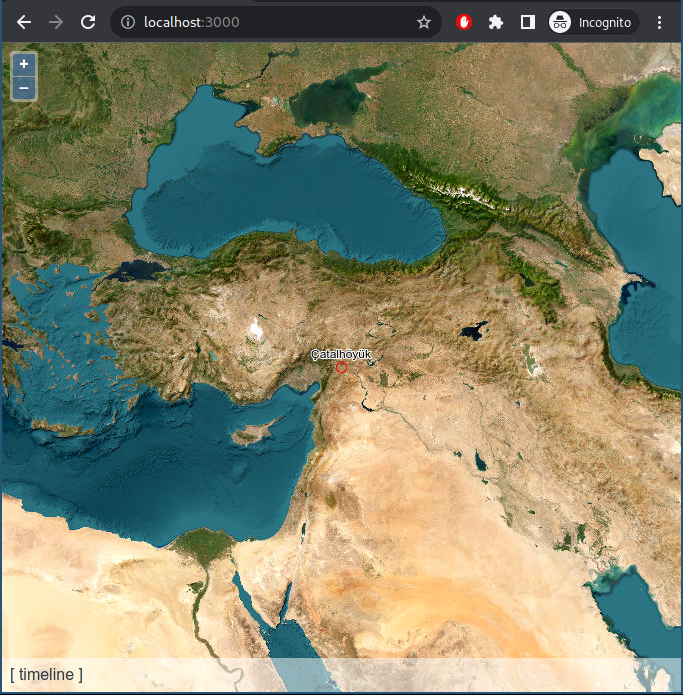
You can pan & zoom, with the left / middle mouse button.
The idea is that 32 x 32 = 1024 ...very close to 1000, let's floor it & tell a story!
The grid is representing the last 1 billion years, the last box (lower right) represents the last million years, it in turn has 32 x 32 boxes inside it, each of those represent 1000 years, next down 1 year... 8 hours, 30 seconds, 30 ms, 30 µs etc...
The idea here is much like the 32 x 32 grid but instead we have 2 x 2, like this:
---------
| 1 | 2 |
---------
| 3 | 4 |
---------
This would allow for quadrants like:
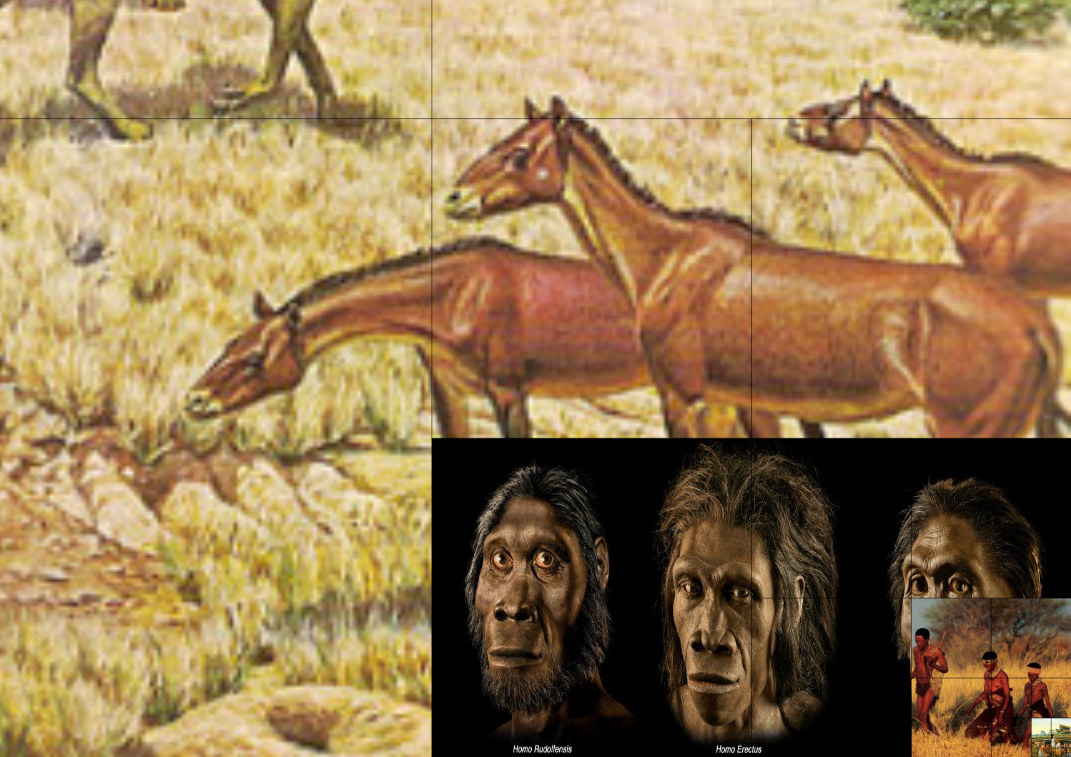
4 mil. years ~=age of Homo.1 mil. years ~= ...250 000 years ~=age of Homo Sapiens._62 250 years ~=the Cognitive Revolution (Yuval Noah Harari) & Lion-man sculpture.15 625 years ~=Agriculture (a bit younger).3 900 years ~=Agrarian civilizations (a bit older), also ~2 Jesus (a unit of time).977 years ~=...244 years ~=Scientific revolution... or more like the industrial 🧐
So, you'll be off by a bit sometimes but it is not too far off. And each of the above would be represented by a square into which you could fit an image...
Example:
Not yet working on GitHub pages (https://gorbiz.github.io/storymaps/map-timeline/index.html), clone repo & read README.md for instructions.
Looks something like this: