windows_events are not being sent to loki by promtail 2.3.0 #4297
Description
Describe the bug
This has been hard for me to debug, which is why I'm coming here but:
After initially setting up promtail 2.3.0 on a Windows Server 2019 with the following config:
Details
clients:
- url: http://internal-loki:3100/loki/api/v1/push
positions:
  filename: 'C:\ProgramData\promtail\positions.yml'
scrape_configs:
- job_name: windows
  windows_events:
    bookmark_path: 'C:\ProgramData\promtail\event_bookmark_system.xml'
    eventlog_name: System
    locale: 1033
    use_incoming_timestamp: true
    xpath_query: '*'
- job_name: windows
  windows_events:
    bookmark_path: 'C:\ProgramData\promtail\event_bookmark_application.xml'
    eventlog_name: Application
    locale: 1033
    use_incoming_timestamp: true
    xpath_query: '*'
server:
  http_listen_port: 9080
  log_level: info
it worked for a very brief time (a few hours). This was ~3 weeks ago and since then I haven't been able to forward any more windows_events to loki.
- When I run
.\promtail-windows-amd64.exe --config.file="C:\ProgramData\promtail\config.yml" --log.level=debug --dry-run --inspectI can see the windows events being captured, so promtail definitely sees them. - When I run
cat .\file.txt | .\promtail-windows-amd64.exe --stdin --config.file="C:\ProgramData\promtail\config.yml" --client.external-labels=test=yesthe data immediately shows up in loki so there is no network or firewall problem. In fact the loki server and the windows server are on the same network, the only "complication" is that loki is running in docker, is connected to a docker network and port 3100 is mapped to the docker host - I can see with
sudo tcpdump -i any 'port 3100'on the loki server that there are packets coming from and to my Windows Server. Quite a few have 0 byte length but there are also packets containing data (usually between 600 and 1500 bytes) - The promtail logfile on the Windows Server is absolutely empty, after the initial
msg="Starting Promtail"there is no more entries. - The loki logs don't contain anything directly related to this promtail client or the server it's on - mostly just table index messages
To Reproduce
I don't have a surefire way to reproduce unfortunately.
Basically:
- Run promtail 2.3.0 on a Windows Server 2019 with the config I posted above
- Observe logs possibly coming into loki (e.g. through grafana explore tab)
- Wait a day, maybe reboot the windows server, maybe stop and start the promtail process a few times
- Cross fingers?
- Get into the state I have where no logs are being seen by loki. It can't be that rare because I have this on three servers now, the time for which it works never lasts long
Expected behavior
The windows event logs should be sent to loki and visible in grafanas explore tab.
Environment:
- Infrastructure:
- loki and grafana docker containers on a Ubuntu 20.04.3 LTS host
- promtail windows binary running on Windows Server 2019 Core ( Build 10.0.17763.2114 )
- Deployment tool: ansible for both, mostly internal roles
Screenshots, Promtail config, or terminal output
Logs being seen when dry-running:
Details
PS C:\Program Files\promtail> .\promtail-windows-amd64.exe --config.file="C:\ProgramData\promtail\config.yml" --log.level=debug --dry-run --inspect
Clients configured:
----------------------
url: http://internal-loki:3100/loki/api/v1/push
batchwait: 1s
batchsize: 1048576
follow_redirects: false
backoff_config:
  min_period: 500ms
  max_period: 5m0s
  max_retries: 10
timeout: 10s
tenant_id: ""

level=debug ts=2021-09-09T13:39:06.8490364Z caller=win_eventlog.go:397 msg="Subcribed with handle id" id=2
level=info ts=2021-09-09T13:39:06.8501032Z caller=server.go:239 http=[::]:9080 grpc=[::]:9095 msg="server listening on addresses"
level=info ts=2021-09-09T13:39:06.8506555Z caller=main.go:119 msg="Starting Promtail" version="(version=, branch=, revision=)"
2021-09-09T15:39:06.8527463+0200{channel="System", computer="server-with-promtail.domain.local"}{"source":"Service Control Manager","channel":"System","computer":"server-with-promtail.domain.local","event_id":7036,"level":4,"levelText":"Information","keywords":"Classic","timeCreated":"2021-09-09T13:22:48.502237200Z","eventRecordID":210902,"execution":{"processId":664,"threadId":10056,"processName":"services.exe"},"user_data":"\u003cData Name='param1'\u003eNetwork Setup Service\u003c/Data\u003e\u003cData Name='param2'\u003erunning\u003c/Data\u003e\u003cBinary\u003e4E0065007400530065007400750070005300760063002F0034000000\u003c/Binary\u003e","event_data":"\u003cData Name='param1'\u003eNetwork Setup Service\u003c/Data\u003e\u003cData Name='param2'\u003erunning\u003c/Data\u003e\u003cBinary\u003e4E0065007400530065007400750070005300760063002F0034000000\u003c/Binary\u003e","message":"The Network Setup Service service entered the running state."}
2021-09-09T15:39:06.8563497+0200{channel="System", computer="server-with-promtail.domain.local"}{"source":"Service Control Manager","channel":"System","computer":"server-with-promtail.domain.local","event_id":7036,"level":4,"levelText":"Information","keywords":"Classic","timeCreated":"2021-09-09T13:25:22.327619200Z","eventRecordID":210903,"execution":{"processId":664,"threadId":9460,"processName":"services.exe"},"user_data":"\u003cData Name='param1'\u003eBackground Intelligent Transfer Service\u003c/Data\u003e\u003cData Name='param2'\u003erunning\u003c/Data\u003e\u003cBinary\u003e42004900540053002F0034000000\u003c/Binary\u003e","event_data":"\u003cData Name='param1'\u003eBackground Intelligent Transfer Service\u003c/Data\u003e\u003cData Name='param2'\u003erunning\u003c/Data\u003e\u003cBinary\u003e42004900540053002F0034000000\u003c/Binary\u003e","message":"The Background Intelligent Transfer Service service entered the running state."}
2021-09-09T15:39:06.8563497+0200{channel="System", computer="server-with-promtail.domain.local"}{"source":"Service Control Manager","channel":"System","computer":"server-with-promtail.domain.local","event_id":7036,"level":4,"levelText":"Information","keywords":"Classic","timeCreated":"2021-09-09T13:25:23.140121500Z","eventRecordID":210904,"execution":{"processId":664,"threadId":10056,"processName":"services.exe"},"user_data":"\u003cData Name='param1'\u003eWMI Performance Adapter\u003c/Data\u003e\u003cData Name='param2'\u003erunning\u003c/Data\u003e\u003cBinary\u003e77006D006900410070005300720076002F0034000000\u003c/Binary\u003e","event_data":"\u003cData Name='param1'\u003eWMI Performance Adapter\u003c/Data\u003e\u003cData Name='param2'\u003erunning\u003c/Data\u003e\u003cBinary\u003e77006D006900410070005300720076002F0034000000\u003c/Binary\u003e","message":"The WMI Performance Adapter service entered the running state."}
2021-09-09T15:39:06.8593804+0200{channel="System", computer="server-with-promtail.domain.local"}{"source":"Service Control Manager","channel":"System","computer":"server-with-promtail.domain.local","event_id":7036,"level":4,"levelText":"Information","keywords":"Classic","timeCreated":"2021-09-09T13:27:23.631492800Z","eventRecordID":210905,"execution":{"processId":664,"threadId":7748,"processName":"services.exe"},"user_data":"\u003cData Name='param1'\u003eWMI Performance Adapter\u003c/Data\u003e\u003cData Name='param2'\u003estopped\u003c/Data\u003e\u003cBinary\u003e77006D006900410070005300720076002F0031000000\u003c/Binary\u003e","event_data":"\u003cData Name='param1'\u003eWMI Performance Adapter\u003c/Data\u003e\u003cData Name='param2'\u003estopped\u003c/Data\u003e\u003cBinary\u003e77006D006900410070005300720076002F0031000000\u003c/Binary\u003e","message":"The WMI Performance Adapter service entered the stopped state."}
[... more logs cut for brevity ...]
Data coming in example when piping from stdin:
Details
PS C:\Program Files\promtail> echo "Hello from promtail!" | .\promtail-windows-amd64.exe --stdin --config.file="C:\ProgramData\promtail\config.yml" --client.external-labels=test=yes
level=info ts=2021-09-09T13:43:44.4766404Z caller=server.go:239 http=[::]:9080 grpc=[::]:9095 msg="server listening on addresses"
level=info ts=2021-09-09T13:43:44.4766404Z caller=main.go:119 msg="Starting Promtail" version="(version=, branch=, revision=)"
PS C:\Program Files\promtail>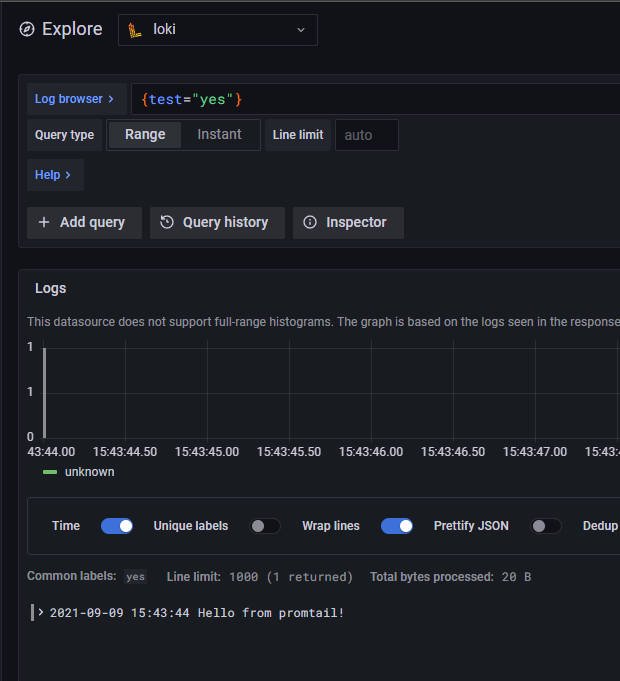
I realize this may not be much to go on and I'm sorry for that, but the logs just didn't give me much to work with. I will gather any additional information I can to assist in resolving this - we really want to use promtail for windows events.
Thank you!