I spotted this overlooked issue while working a new tinyplot.matrix method (and will submit a fix as part of that PR).
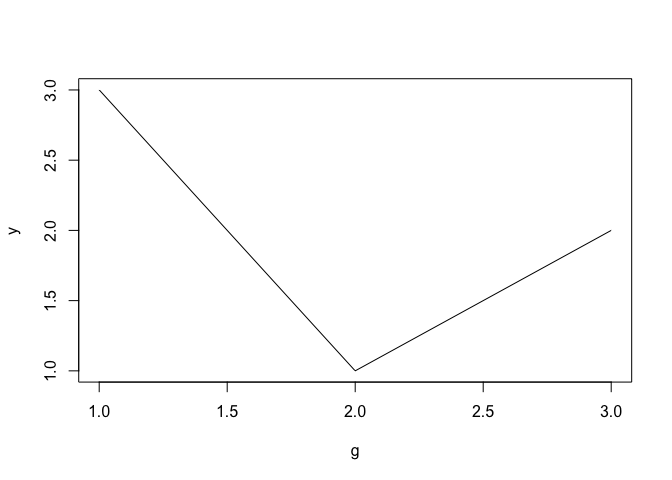
Line-family plot types ("l", "b", "o", etc.) don't render the category labels on the x-axis when x is a factor/character. Point plots ("p") do. The line plot still draws at the correct positions, but the ticks fall back to bare integers (1, 2, 3, …) instead of the factor levels.
library(tinyplot)

dat = data.frame(
  g = factor(c("lo", "mid", "hi"), levels = c("lo", "mid", "hi")),
  y = c(3, 1, 2)
)

tinyplot(y ~ g, data = dat, type = "p")   # x-axis: lo, mid, hi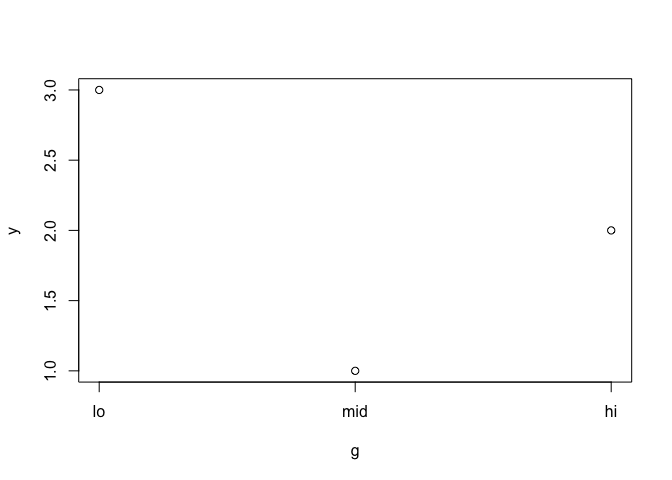
tinyplot(y ~ g, data = dat, type = "l") # x-axis: 1, 2, 3 (labels lost)
tinyplot(y ~ g, data = dat, type = "b") # x-axis: 1, 2, 3 (labels lost)

Created on 2026-06-25 with reprex v2.1.1
Root cause is twofold: (1) data_lines() only builds the xlabs lookup when dodging is active, and (2) the axis-drawing code in facet.R keys label rendering off a hardcoded type allowlist that omits the line types. Both should be straightforward fixes.
P.S. I know that ggplot2 does let you draw lines across faceted categories, but there are often times when I think it makes visual sense to do so (we already have some exceptions for ribbon plot and co.).
I spotted this overlooked issue while working a new
tinyplot.matrixmethod (and will submit a fix as part of that PR).Line-family plot types (
"l","b","o", etc.) don't render the category labels on the x-axis whenxis a factor/character. Point plots ("p") do. The line plot still draws at the correct positions, but the ticks fall back to bare integers (1, 2, 3, …) instead of the factor levels.Created on 2026-06-25 with reprex v2.1.1
Root cause is twofold: (1)
data_lines()only builds thexlabslookup when dodging is active, and (2) the axis-drawing code infacet.Rkeys label rendering off a hardcodedtypeallowlist that omits the line types. Both should be straightforward fixes.P.S. I know that
ggplot2does let you draw lines across faceted categories, but there are often times when I think it makes visual sense to do so (we already have some exceptions for ribbon plot and co.).