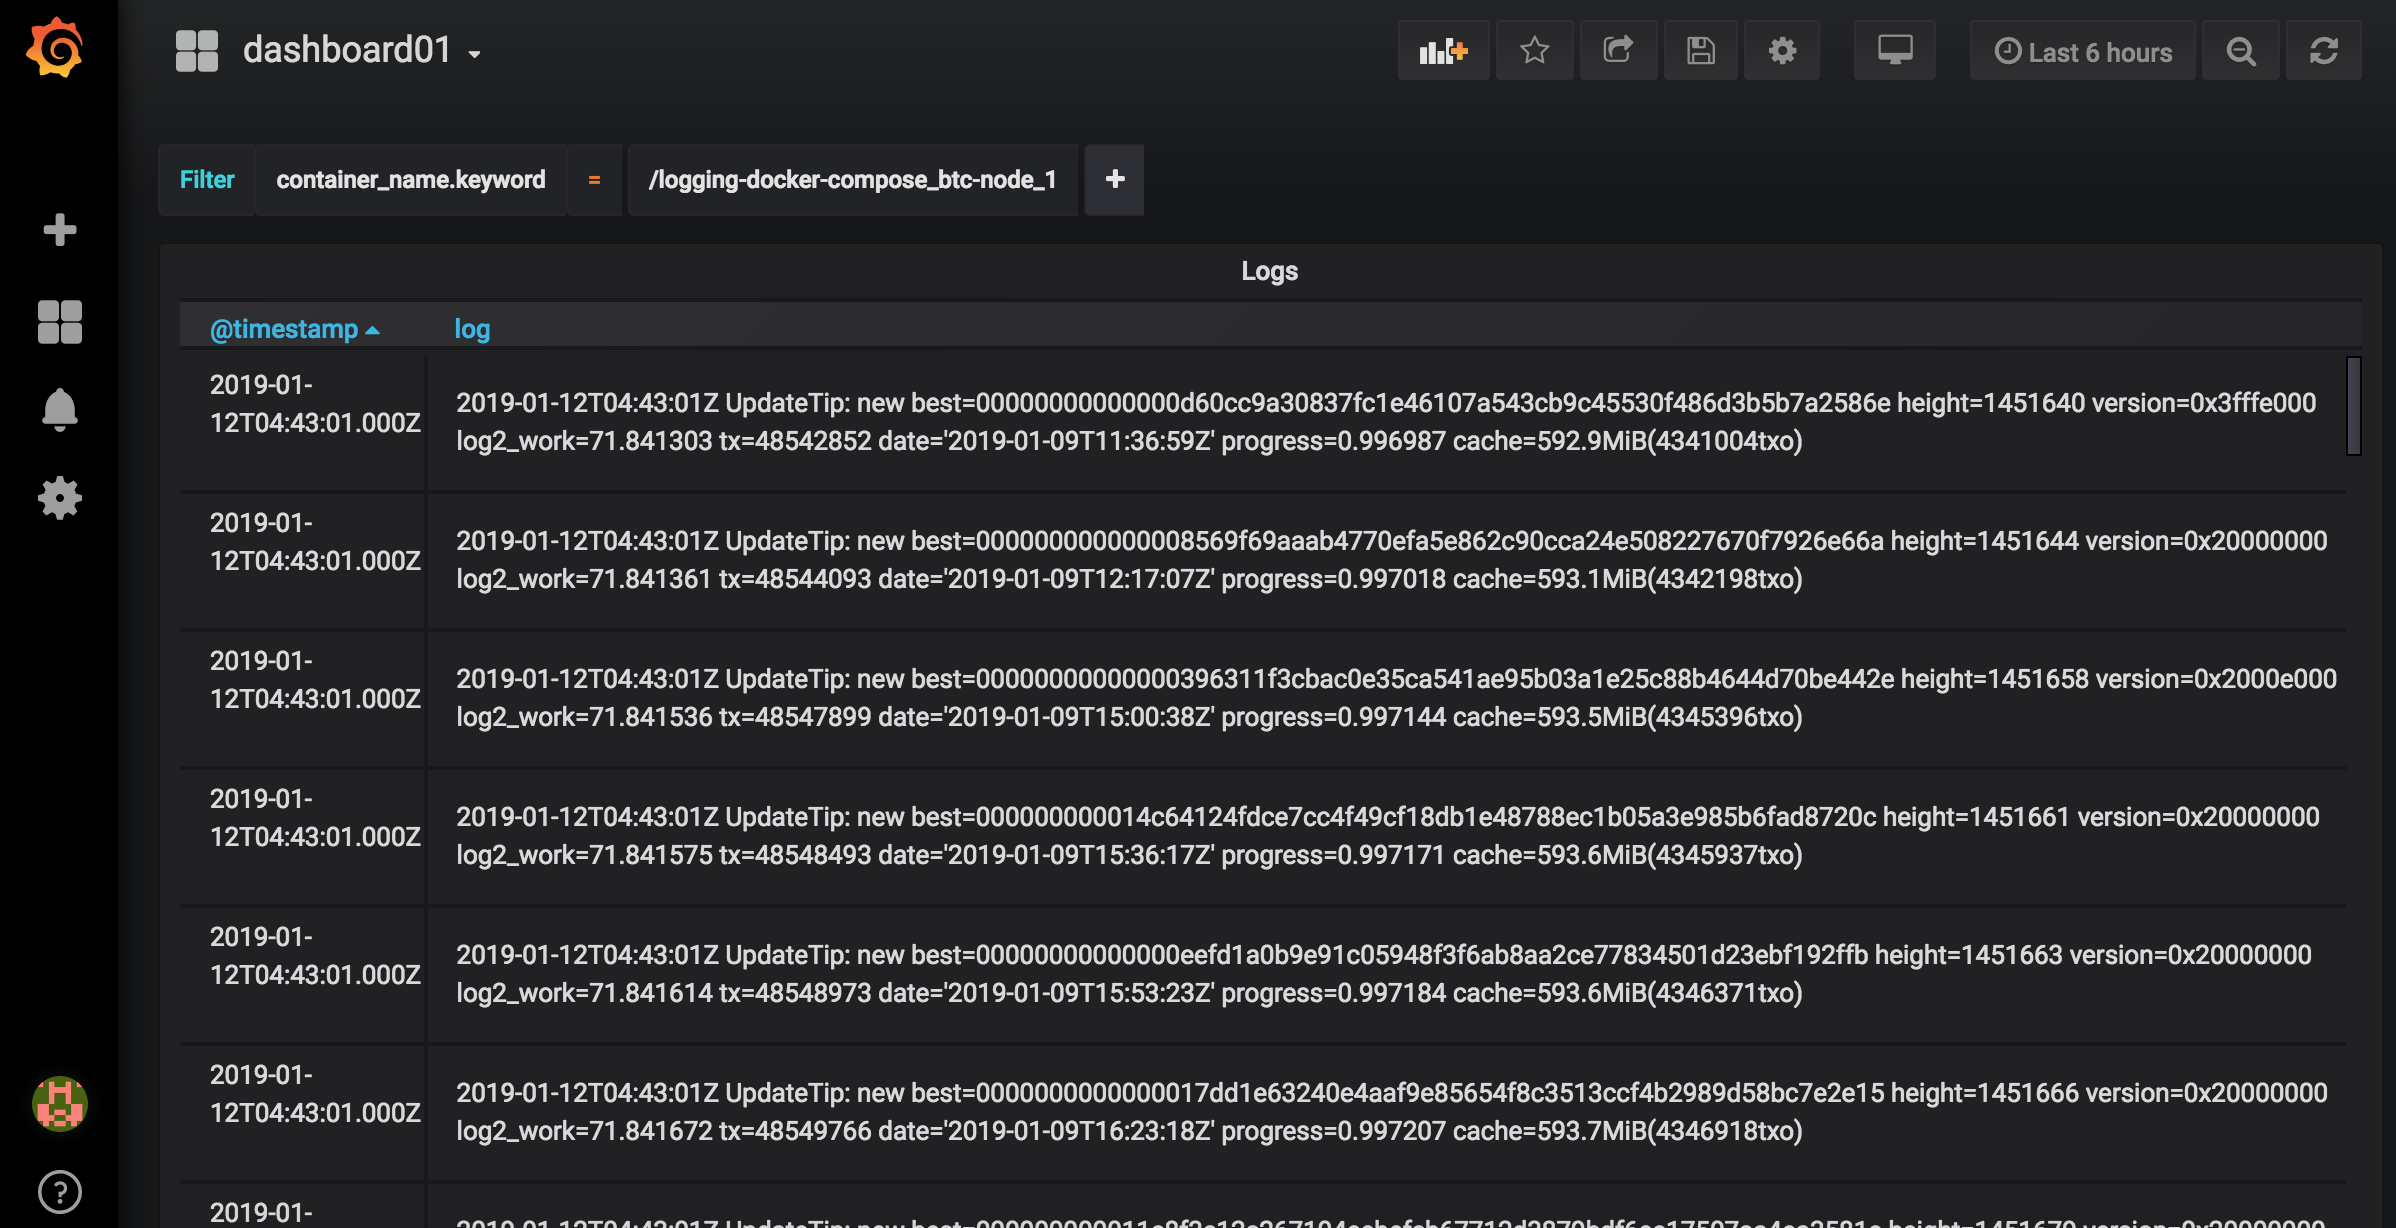
logging on docker-compose
- Click on the Add Data Source button to be taken to the new data source form.
- In the name, enter Logs.
- Choose Elasticsearch in the Type drop down.
- Enter http://elasticsearch:9200 for the URL.
- In Index Name enter
[logstash-]YYYY.MM.DDand chooseDailyin the Pattern field, otherwise errorno indexwill occur.

-
In the left sidebar hover over the plus icon[+] and choose Dashboard.
-
Choose Table as the panel type and a table will appear.
-
Drag the bottom right corner of the table to fill the window.
-
To edit the contents of the table, hover over the title bar for the table and choose Edit.
-
Click on the General tab and give your table the Title field
Logs. -
Click on the Metrics tab and choose
Elasticsearchin the Data Source field from drop down. -
For the Metric field, click and change it to
Raw Document. -
Click on the Options tab and change the Table Transform to JSON Data.
-
Click the [+] icon next to Columns field and choose
@timestamp. -
Click the [+] icon again and choose
log. -
Close the edit panel.
-
From the created dashboard(left panel), click on the
gearicon in the top right corner to open the Dashboard settings. -
On the left side, click on Variables and click the
Add Variablebutton. -
Under Name, enter
filter. -
For Label, enter
Filter. -
Under Type, choose
Ad hoc filters. -
Under Data Source choose
Elasticsearch. -
Click the
Addbutton. -
Click the back arrow in the top right corner to return to the Dashboard.
-
Return to Dashboard, and add
container_name.keywordas Filter name and choose container.