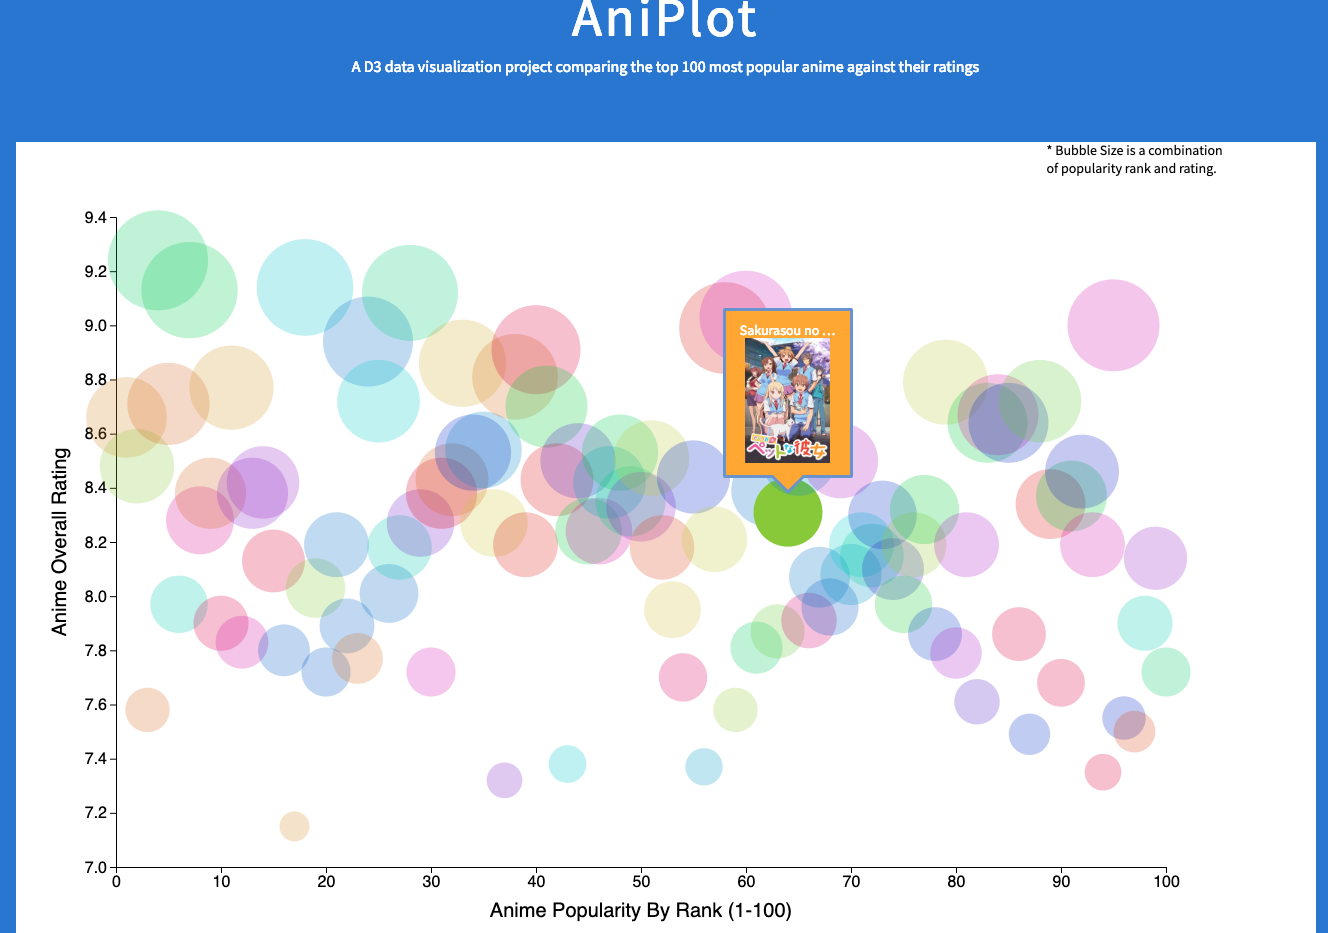
AniPlot is a personal javascript project using the D3 (Data Driven Documents) library. The website collects data using an external api and displays a plot comparing Anime shows based on ratings versus popularity. Users are able to hover over data points for brief information or click on the data point for additional information.
- Javascript
- Data Driven Documents (D3) Library
- Node JS
- DOM Manipulation
- External APIs
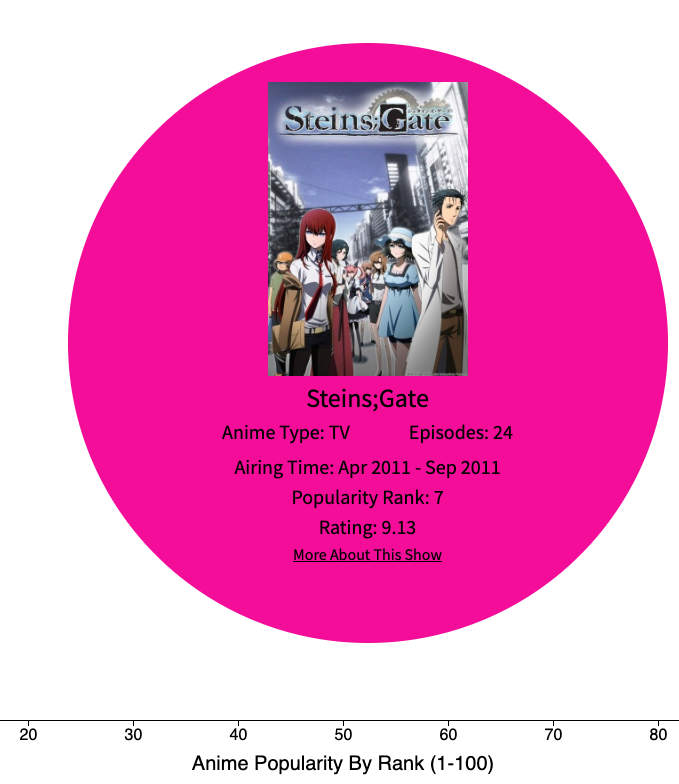
This feature allows users to click on data points and will display detailed information about the selected show. This info content is displayed in the middle of the chart and all other data points are hidden. This was done by appending a new element to the DOM with the selected shows' information by adding an on click function to each 'circle' ie: data point.
   const handleClick = (d) => {
        tip.hide();
        d3.selectAll('circle')
            .style('visibility', 'hidden');

       select('.main')
        .append('div')
        .attr('class', 'info')
        .style('display', 'flex')
           .html(`<div class="infoimg"><img src=${d.image_url} alt=""></div>
            <div class='infotitle'>${d.title}</div>
            <div class="firstsub">
                <div class="type">
                    Anime Type:  ${d.type}
                </div>
                <div class="episodes">
                Episodes:  ${d.episodes}
                </div>
            </div>
            <div class="secondsub">
                <div class="startdate">
                    Airing Time: ${d.start_date} - ${d.end_date}
                </div>

            </div>
            <div class="inforank">Popularity Rank: ${d.rank}</div>
            <div class="infoscore">Rating: ${d.score}</div>
            <a href=${d.url}>More About This Show</a>


      `).style("background", () => {
          return "hsl(" + Math.random() * 360 + ",100%,45%)";
      }).transition().duration(200).delay(2)

    };
One main goal of this project was to generate html elements using a given dataset. I was able to acheive this by using D3 methods which allow for data to be binded to a new html element. This allows for dynamic functionality as the tool tips on hover will display info specific to each data point.
  g.selectAll('circle')
        .data(dataset)
        .enter().append('circle')
        .attr('class', 'node')
        .attr('cy', d => yScale(yValue(d)))
        .attr('cx', d => xScale(xValue(d)))
        .attr('r', d => { return rScale((((d.score - 7) / 9.5) * 50)) })
        .attr("fill", () => {
            return "hsl(" + Math.random() * 360 + ",100%,40%)";
        }).attr("opacity", 0.6)
        .on('mouseover', function (d) {
            d3.selectAll('circle').style('opacity', 0.25)
            select(this).style('opacity', 1);
            tip.show(d, this);
        })
        .on('mouseout', function (d) {
            select(this).style('opacity', 0.5);
            d3.selectAll('circle').style('opacity', 0.5);
            tip.hide();
        })
        .on("click", handleClick)
        .call(tip);