Grid version of FR layout does not work properly with disconnected graphs #2068
Description
Describe the bug
The layout produced from layout_fruchterman_reingold() looks disordered when plotting large graphs with thousands of vertices.
To reproduce
Run the following code:
from igraph import *

# Create graph
my_graph = Graph()

# Create list of edges
edge_list = [(10,3), (10,444), (8,4), (3,5), (5,4)]

# Add vertices
my_graph.add_vertices(2000)

# Add edges to the graph
my_graph.add_edges(edge_list)

# Set visual styles
visual_style = {}
visual_style["bbox"] = (3000,3000)
visual_style["margin"] = 30
visual_style["vertex_size"] = 30
visual_style["vertex_label_size"] = 12
visual_style["edge_curved"] = False

# Set the layout
visual_style["layout"] = my_graph.layout_fruchterman_reingold()

# Plot the graph
plot(my_graph, "testing.png", **visual_style)
Output graph testing.png:
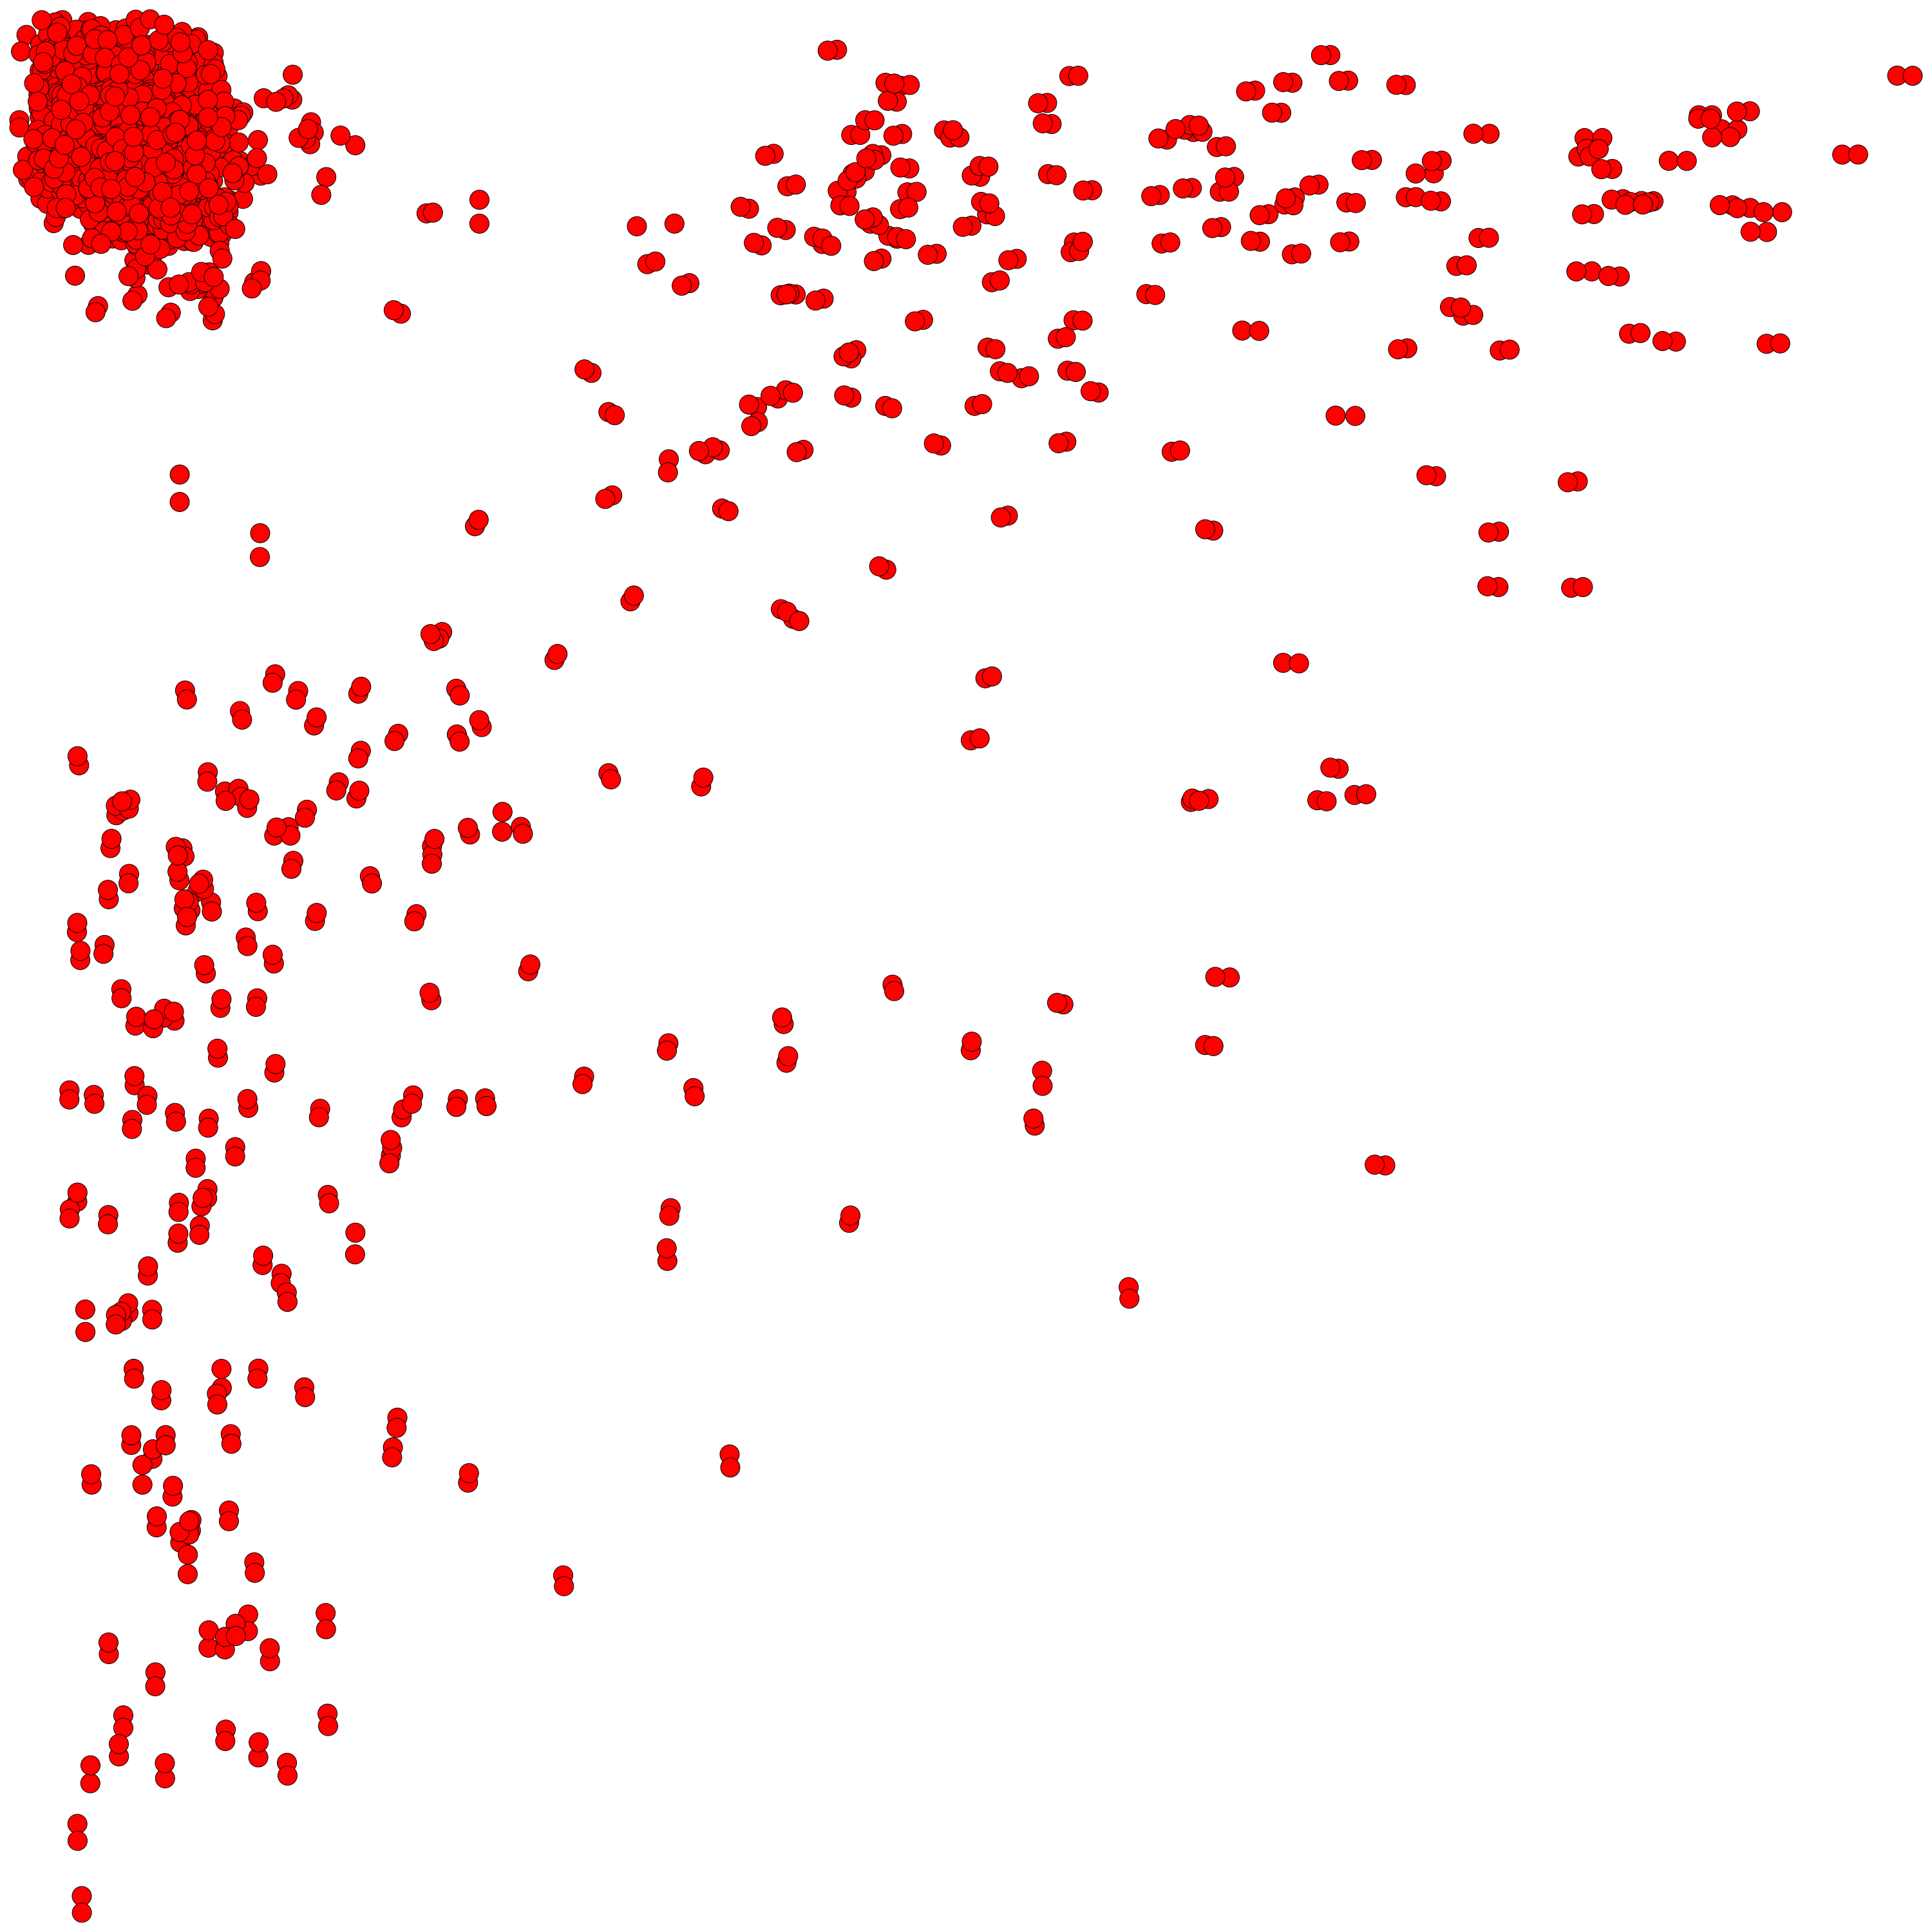
I am not sure where the issue is occurring or starting from which version.
Version information
I came across this issue with versions 0.9.10, 0.9.9 and 0.9.8 from conda.
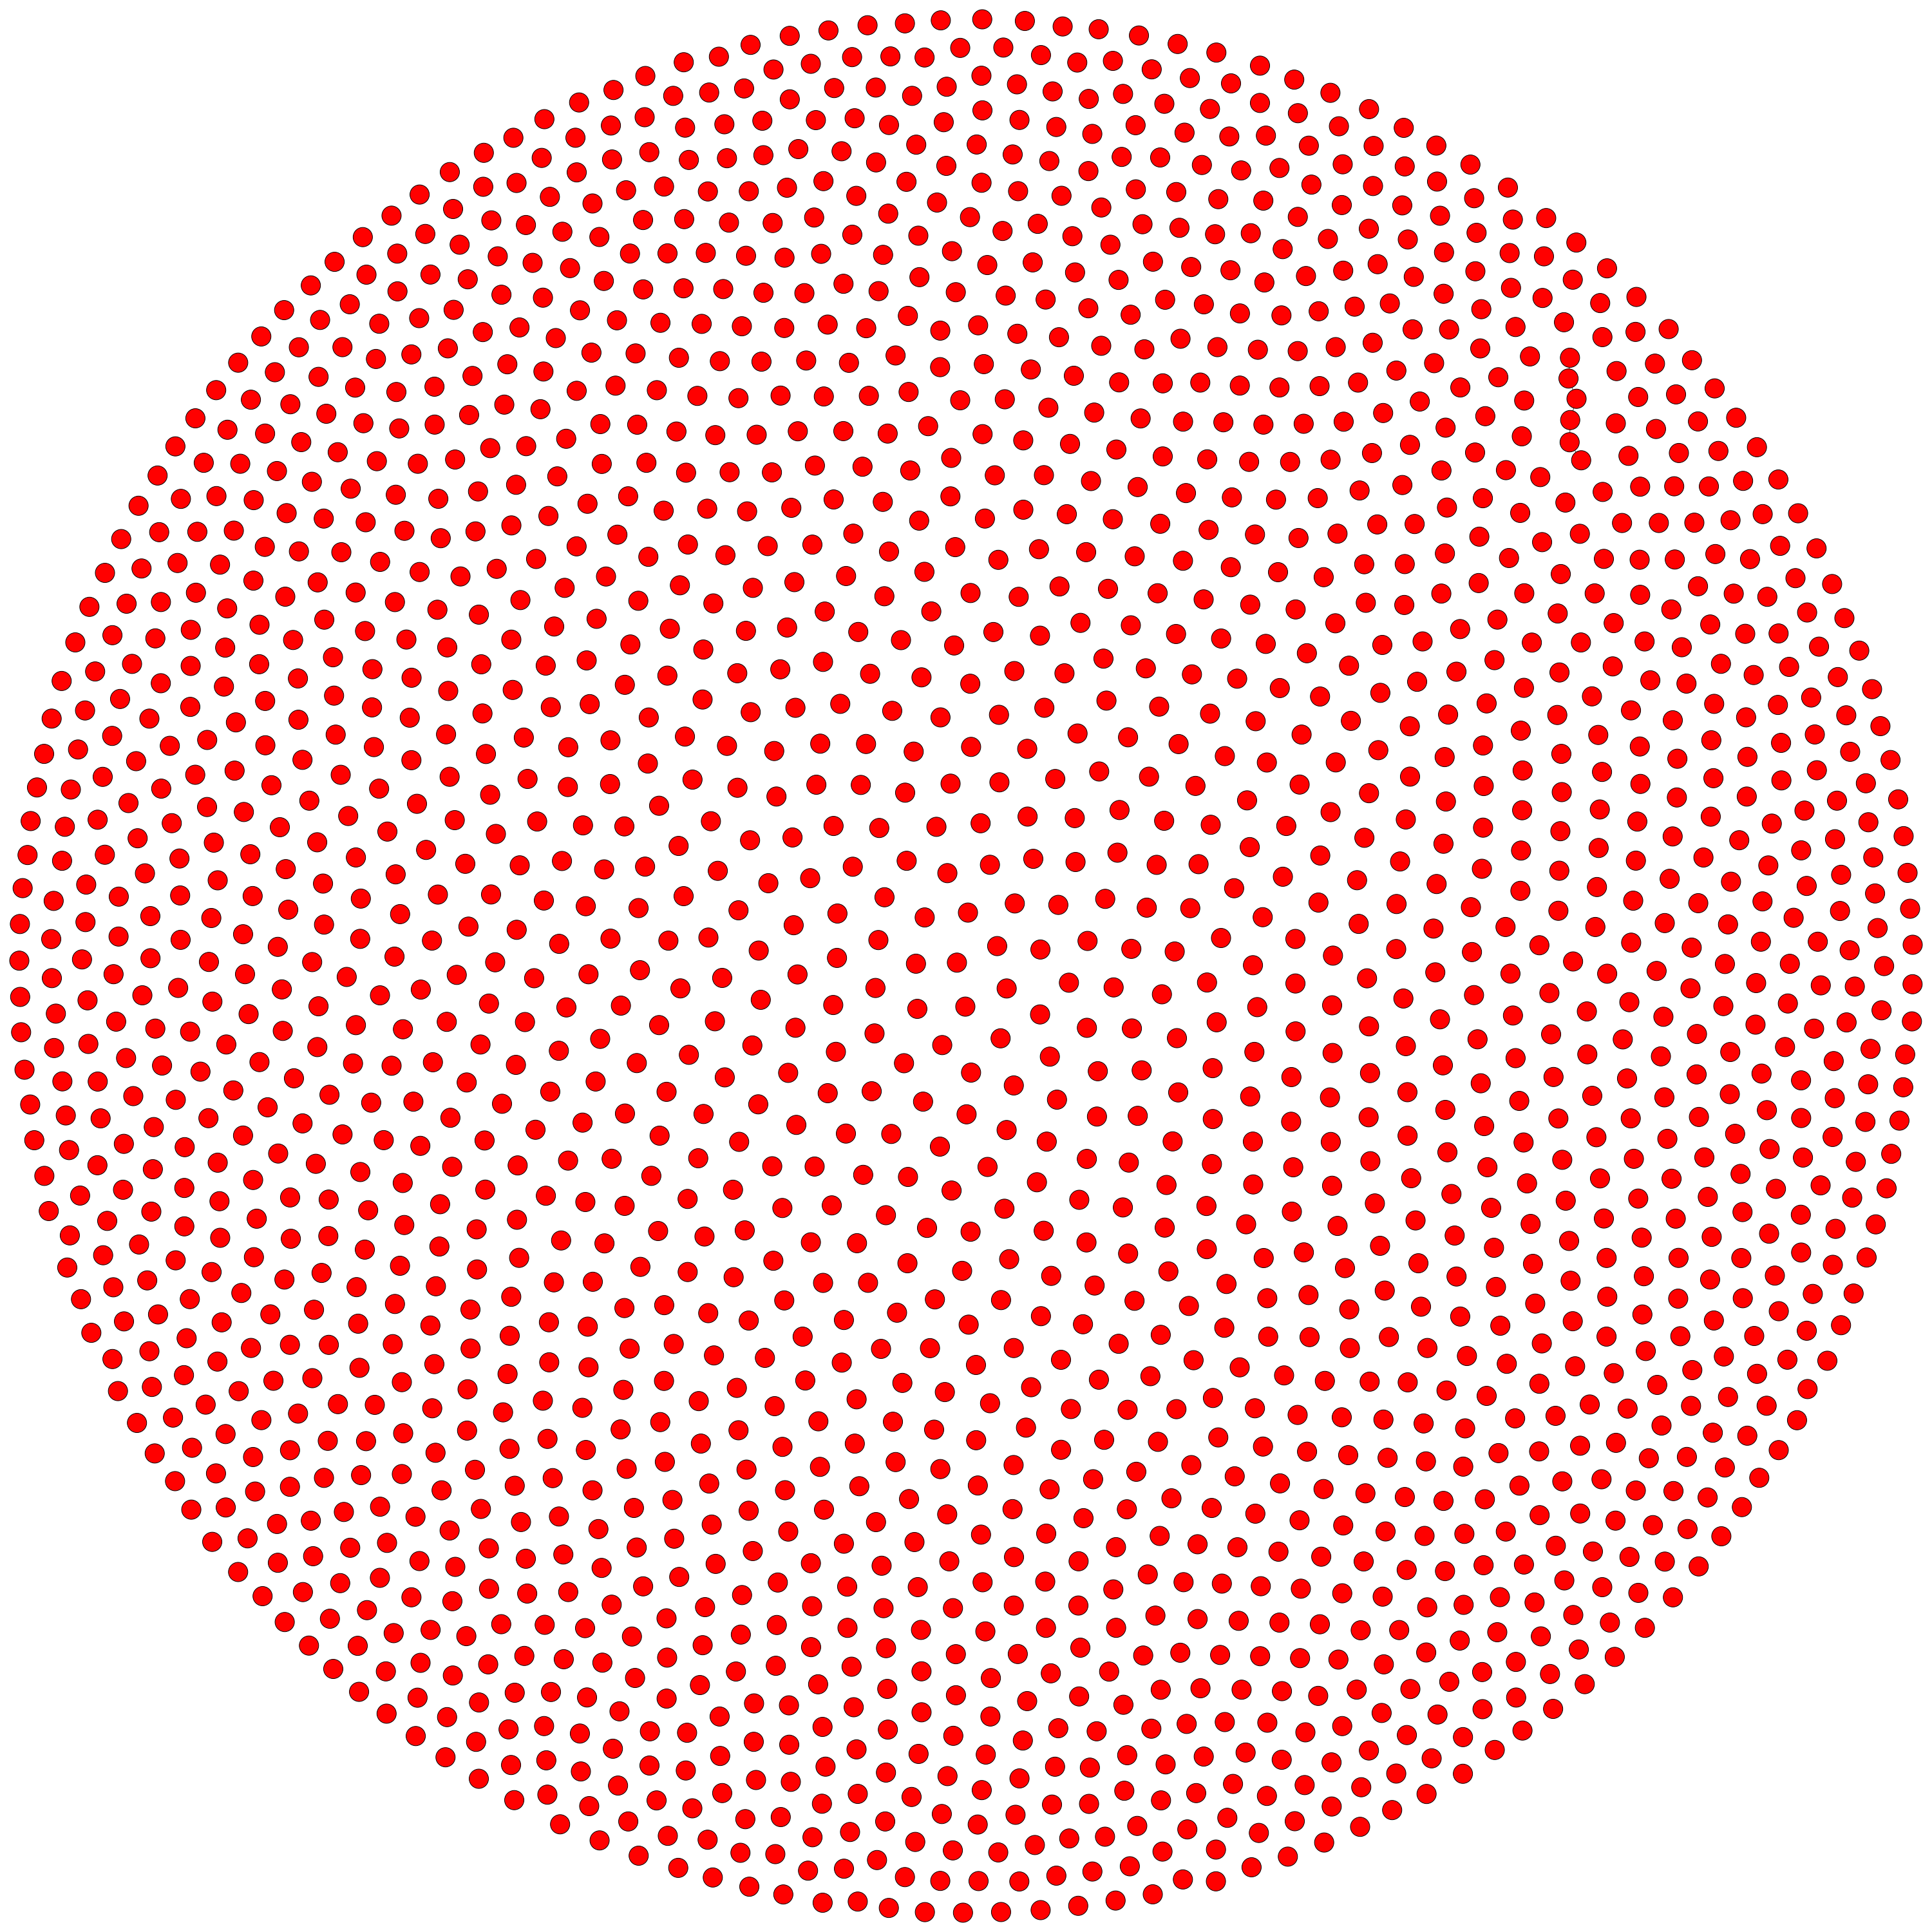
Versions that worked correctly
When I plot using python-igraph version 0.7.1.post7 from conda, I get the proper layout as shown below: