Part 6. Process Dashboard
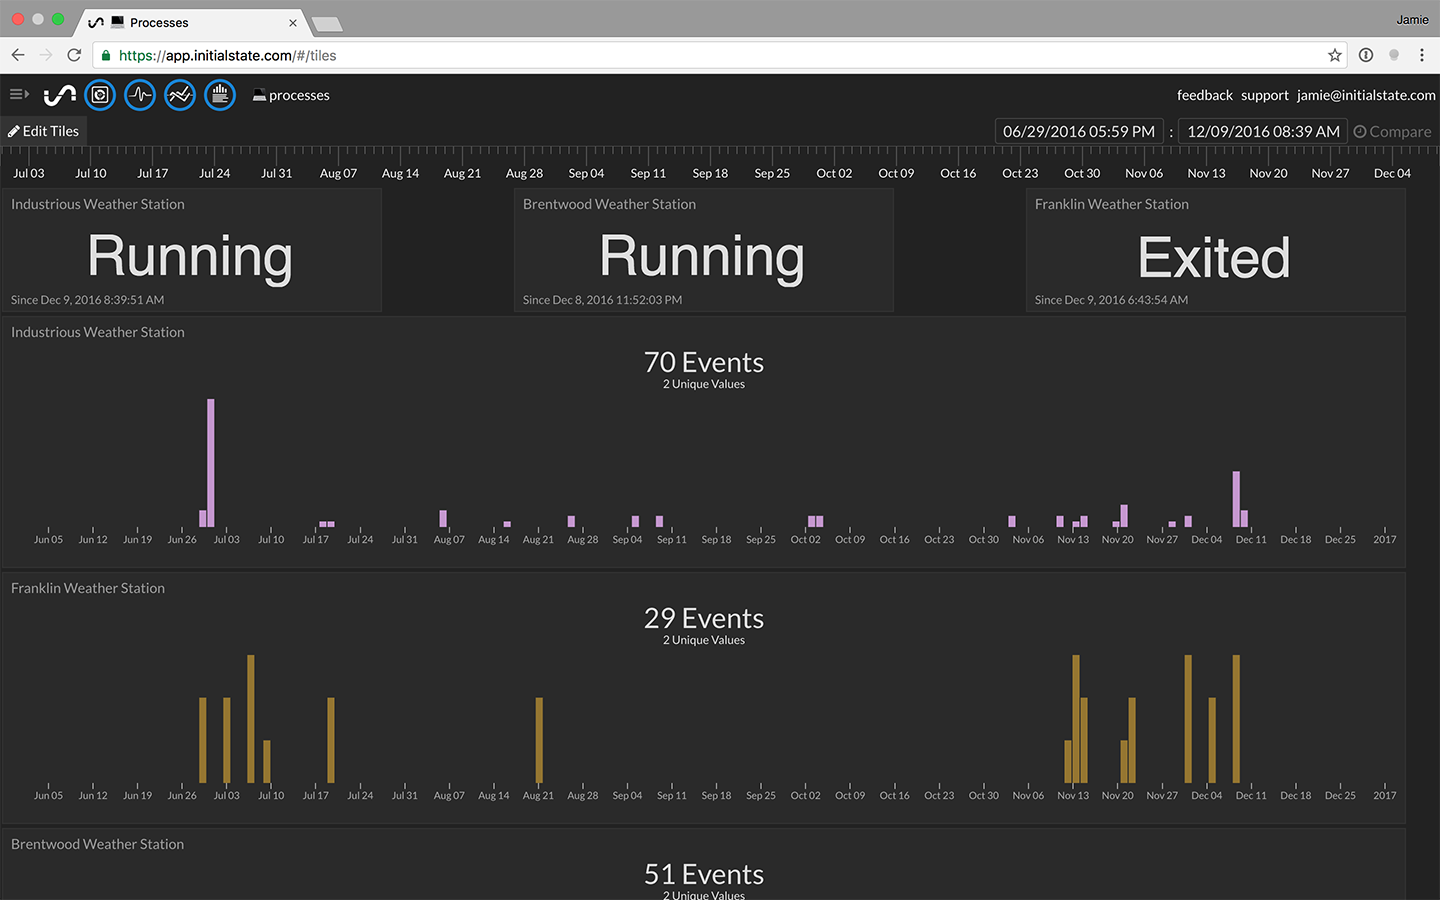
Each process that you monitor will add a data tile to your dashboard. This can be extremely useful if you have an application where multiple Pis are deployed across multiple locations. For example, if a Pi is used to monitor temperature in every room in your office building, you can quickly see the status of every Pi at-a-glance.
Adding additional tile data views such as the histograms can be added to your dashboard. Check out our support page to learn more about different available data types.
<< Part 5: Automatically Launch on Boot - Part 7: Notifications on Process Exit >>