3) Topology generation (example)
In this section, we explore how we can create different topologies on P7 and where can you find a generated topology visualization. On the First Page, we showed the methods (e.g., addSwitch(...)) and parameters needed to create a customized topology - with hosts, switches and links. Now, let's understand how the topology creation (at main.py maps into a graph visualization with our topology generator gen_topo.
After defining a customized network topology in main.py, we call a function - at the end of the file - to set up our graph visualizer, which is defined inside data.py.
topo.generate_graph()At the end of the file (data.py), we call our topology generator (gen_topo), which receives a list of paths (self.tabelEnt_dijkstra) to represent the topology as an input.
def generate_graph(self):
	print("\nNetwork Topology created files/topo.png\n")
	gen_topo(self.tableEnt_dijkstra)
With that list, we treat our input, create a graph object g = nx.Graph() (gen_topo) and, as output, we generate our topology image. (See the example below).
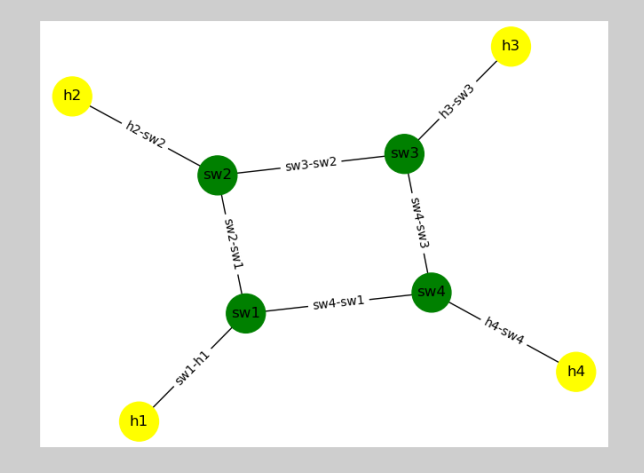
Note: The spatial position of the objects (nodes, links, hosts) is set automatiically. You may experience different positiong which time the code is run.