Used JavaFX to create a visual graph which shows the steps of dijkstras algorithm, turns dijkstra into UI state transition
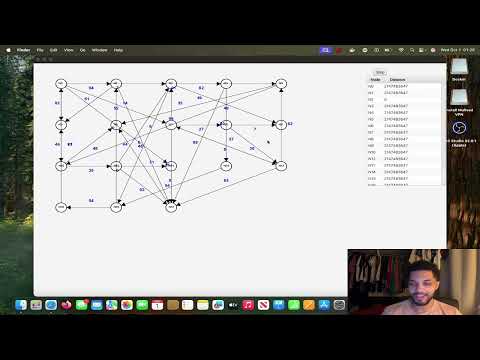
Click the image above to watch a demonstration of the algorithm visualiser.
- Java 17-21
- Git
1. Clone the repository
git clone https://github.com/jbrowne7/javafx-algorithm-visualiser.git
cd javafx-algorithm-visualiser
2. Run using gradle wrapper
On Linux/macOS:
./gradlew run --args dijkstraOn Windows:
gradlew.bat run --args dijkstraRun the application:
./gradlew run --args dijkstraThis package contains implementations of the different algorithms that this project can visualise All algorithms implement the Algorithm interface. Classes in this package:
- Dijkstra
- DFS (not yet implemented)
This package contains the custom data structures used in the project. Classes in this package:
- Edge
- Graph
- Node
- StepResult (used to store the result of each step of the algorithm)
- NodeEntry (used in the priority queue for Dijkstra)
This package contains the user interface components of the project. Classes in this package:
- GraphVisualiser (places UI components for the graph visualisation)
- GraphPane (builds the graph UI (nodes, edges, weights))
- DistancesPane (builds the table with the distances to certain nodes)
- StepButtonPane (builds the step button)
This package contains utility classes and methods used throughout the project. Classes in this package:
- AlgorithmFactory (creates instances of algorithms based on user input)
- GraphBuilder (builds graphs from user input or predefined structures)
- AppConfig (record for configuration settings)
- AppContext (stored configuration settings as AppConfig)
- ArgsParser (parses cmdline arguments)
- Adding more algorithms (e.g. DFS, BFS)
- Highlight the entry in the table that was just updated