
There is an inherent randomness in The Little 500 and luck is undoubtedly an element on race day. Yet when the white flag drops, it's typically the teams expected to contend the podium that are duking it out to cross the finish first.
Each year there is speculation on which teams will be there to contend. These speculations are typically generated by a consensus of feel and are corroborated with crude data from The Spring Series events. I was curious to see whether this speculation by feel method could be approached more scientifically. Using data from Spring Series I set out to make a predictive model for The Little 500.
I started simply by looking at the correlations between different metrics and their association to race day results. These plots can be seen to the right. I defined 'A Riders' as the highest placing ITTer (Individual Time Trial) on their team, 'B Riders' placed second on their team, and 'C Riders' placed third on their team. Although the Little 500 is a four-person relay race, interestingly the plot between 'D Rider' success vs race results did not demonstrate any significant correlation so I chose to exclude it from this analysis. In each plot the y-axis is race day place and the x-axis is a relative ranking among the group being plotted.
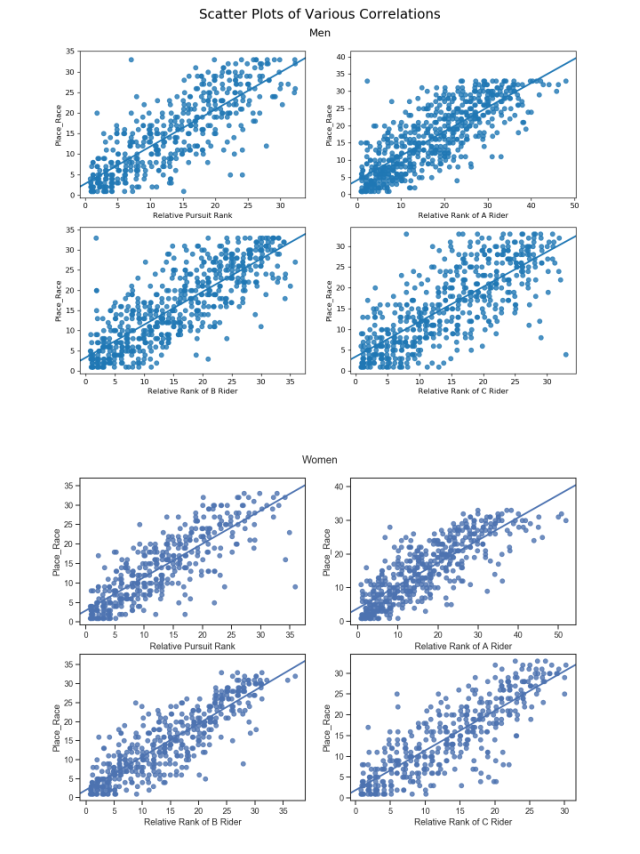
Each ITT entry and Team Pursuit has a z-score associated with that is relative to the other entries from the same year. This accounts for different track and weather conditions from a year to year basis and provides the best measure of the relative strength of each entry. To quantize overall team strength I summed the z-score of each component multiplied by that variable's correlation coefficient.
For example the 2005 entry for Phi Kappa Psi has these components:
Pursuit z-score = -0.636588
A Rider z-score = -1.067234
B Rider z-score = -0.697321
C Rider z-score = -0.662190
Each of these values is weighted by their relevant correlation coefficients from the above plots:
r_pursuit = 0.7999012272314057
r_A Rider = 0.808452499414871
r_B Rider = 0.7623321398236437
r_C Rider = 0.8060171655100812
Then weighted sum calculation is:
weighted_sum = (0.7999012272314057*-0.636588) +
               (0.808452499414871 *-1.067234) +
               (0.7623321398236437*-0.697321) +
               (0.8060171655100812*-0.662190)
weighted_sum = -2.435342
A team's projected place is simply the ranking of their Weighted Sum score from the year.
For example in the year 2004 the weighted sums predict the following race result:
index Team        Projected Place   Weighted Sum      Pursuit    A Rider     B Rider     C Rider
230 Teter               1.0         -5.530155         -1.359333  -1.702069   -1.567271   -0.901482
231 Kappa Kappa Gamma   2.0         -4.536387         -1.022450  -1.468038   -1.072774   -0.973126
232 Kappa Alpha Theta   3.0         -3.737534         -0.830632  -1.187635   -0.983004   -0.736264
233 Delta Zeta          4.0         -3.170507         -0.698091  -1.152857   -0.800420   -0.519140
234 Roadrunners         5.0         -2.726594         -0.502724  -0.852166   -0.712932   -0.658777
Which differs slightly from the actual finishing order:
First : Kappa Kappa Gamma
Second: Teter
Third : Kappa Alpha Theta
Fourth: Alpha Gamma Delta
Fifth : Delta Zeta
The above case worked pretty well, first and second are swapped, third place was guessed correctly, and the team projected to place 4th ended up 5th on race day. To get a sense of how well the model truly predicts race results I defined 'Diff' as the difference between actual placing and projected place (e.g. if a team is projected to finish 5th and they actually finish 2nd on race day, then for that entry Diff = 2). For both the men and women's data sets I created histograms of the distribution of 'Diff'.
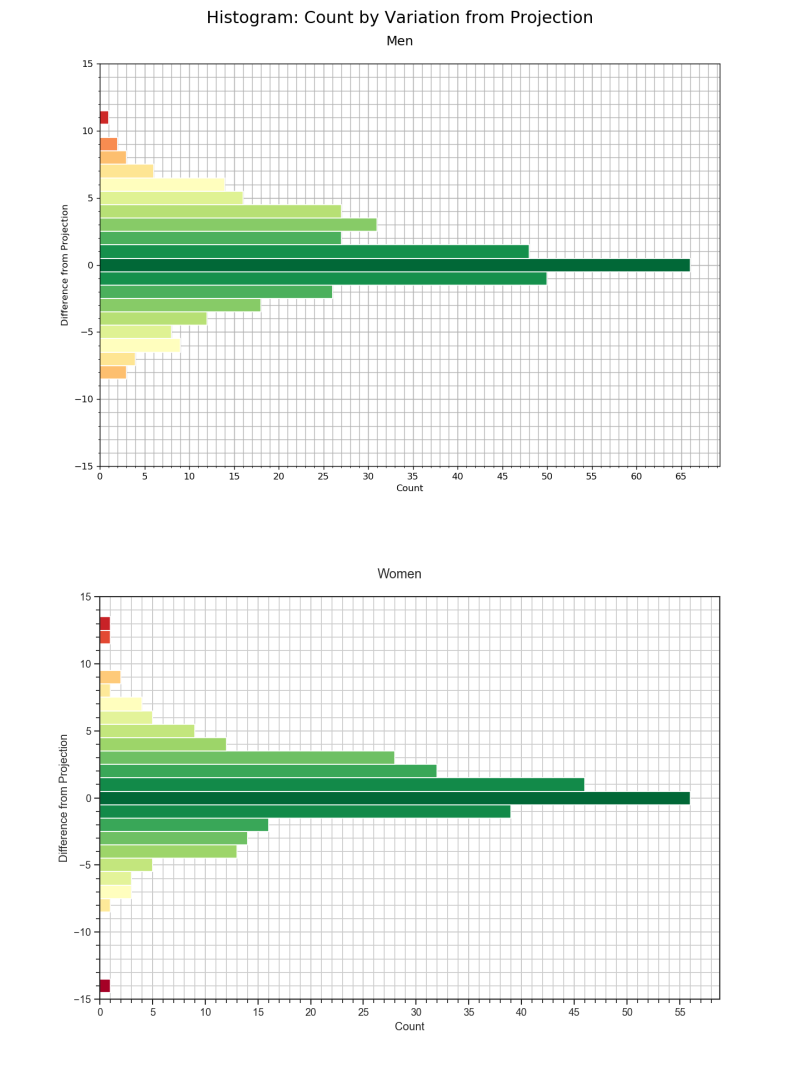
Here the y-axis is the difference a team finished from their projected place. A positive value indicates that a team improved upon their projected finish by that value. A negative value indicates that a team dropped below their expected result. The x-axis is the count of occurrences where a team finished the corresponding amount of places from their projected value.
Both distributions are centered around 0. On the women's side: 19% of the results are predicted correctly, 48% fall within ±1 place from their projection, and 79% fall within ±3 places. For the men: 18% of the results are predicted correctly, 44% fall within ±1 place, and 72% fall within ±3 places.
Below are strip plots of projected place vs. actual results for teams projected to place in the top-15. Each colored point is a real result. The black markers are a representation of the median and their corresponding 90% confidence intervals.
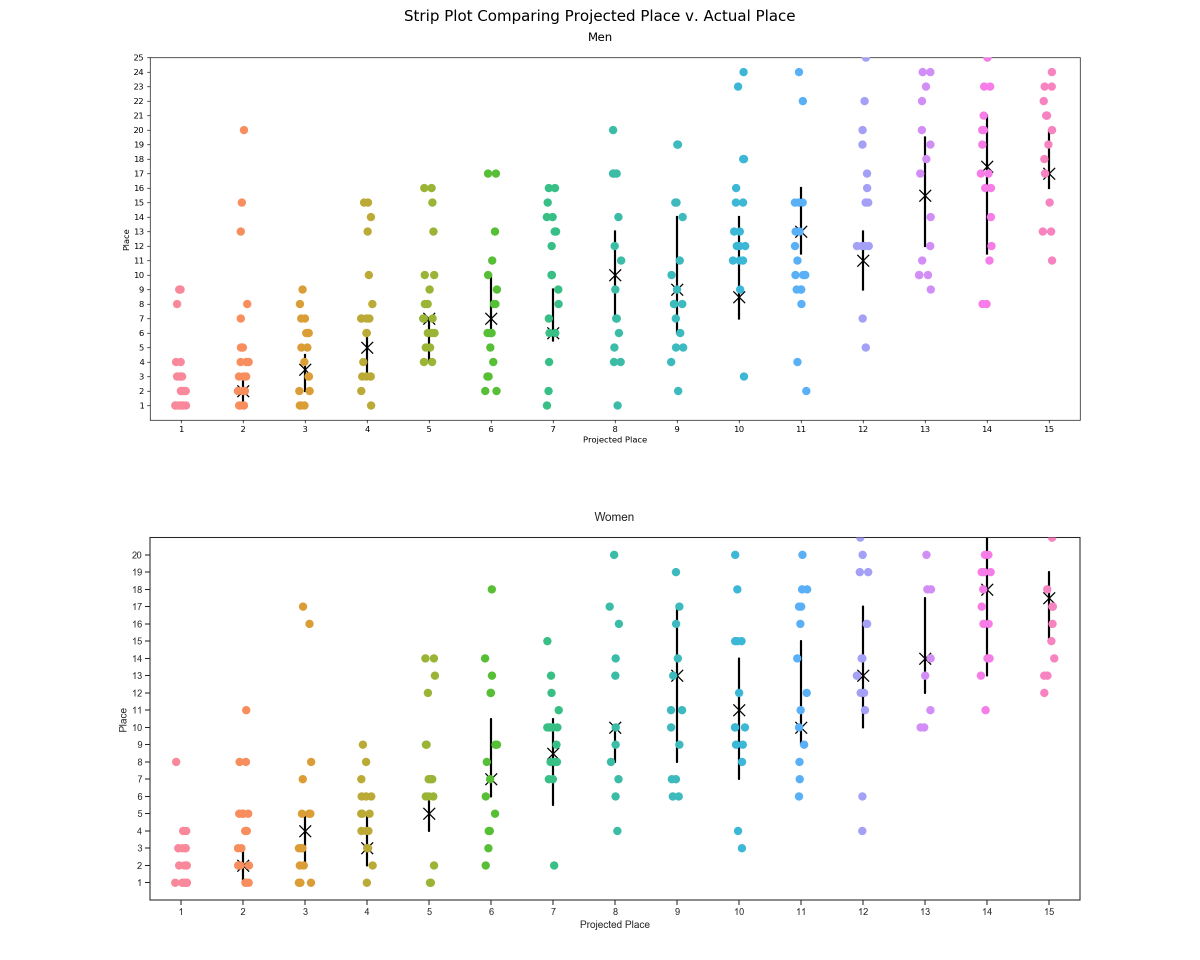
With enough data points the projections fall into place. This is clearly represented by the regression of the median points. I chose to illustrate the trend of the medians rather than the means for the simple reason that means are heavily skewed by outliers. In almost every case the mean takes on a higher value than the median. I suspect this is due to teams getting caught up in wrecks. Crashes are rampant in the Little 500 and even the strongest teams can get caught in them and finish further back than projected. Across the board the effect of crashing skews the means enough to significantly impact the regression.
For any given solitary data point, the model will only yield about a one in five chance that its projection is spot-on. The Little 500 is not won by mathematics. There are far too many variables to be accounted for by any model like this. Despite that, there are some interesting patterns to note. For instance, of the years being modeled, the winner of the women's race has only been won by a team projected outside the top-three on three separate occasions and none of those teams were projected worst than fifth. A similar stat is observed on the men's side: there have only been three times that a team projected outside the top-3 has crossed the finish line first–those winning teams were projected fourth, seventh, and eighth. We can also see that for both the men and women top-three projected teams have only finished outside of the top ten a combined six times. So while there is still a great deal of variance for any given point there are definite trends that can be concluded from this model and about the Little 500 in general.
As years come and go I look forward to adding more data points to this model to see how it holds up over time. The great thing about this model is that nothing in it is hard coded so adding new races as they happen will be seamless.
Joe Krahulik