




phonometry — the measurement of sound. Formerly published as PyOctaveBand.
Acoustic measurement toolkit for Python: fractional octave-band filter banks, frequency and time weighting, and sound level metrology — conformance-tested against IEC 61260-1:2014 / ANSI S1.11-2004 (filters) and IEC 61672-1:2013 (weighting and levels) class 1 tolerance limits.
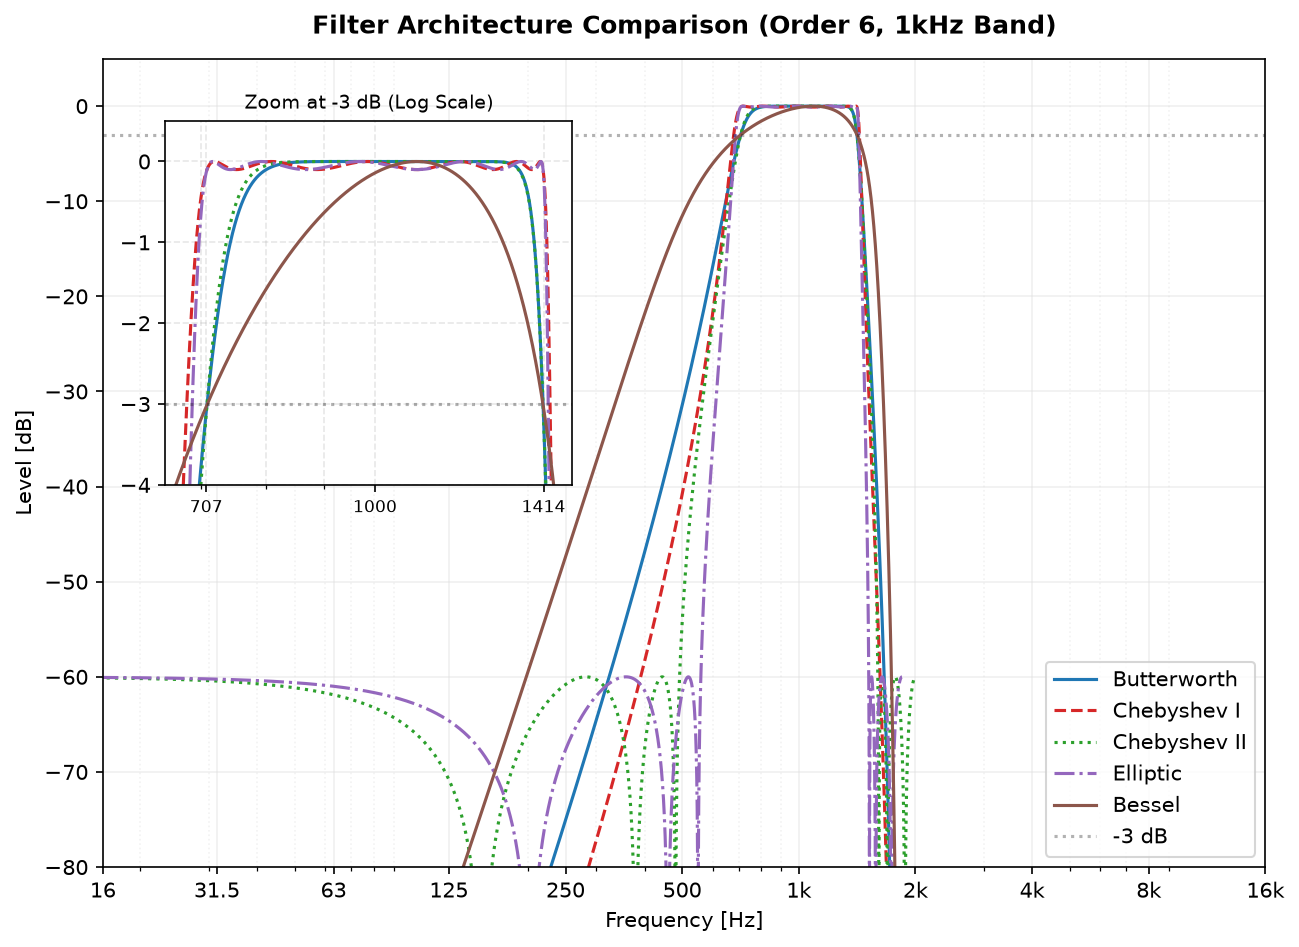
- 🎛️ 1/1, 1/3 and arbitrary fractional octave filter banks (stable SOS + multirate decimation)
- 🏗️ Five architectures: Butterworth, Chebyshev I/II, Elliptic, Bessel — all with −3 dB points on the ANSI band edges
- 🔊 A/C/Z frequency weighting within IEC 61672-1 class 1 tolerances
- ⏱️ Fast/Slow/Impulse time ballistics,
Leq,LAeqandL10/L50/L90statistical levels - 🗺️ Octave spectrogram (band levels over time) and zero-phase offline filtering
- 📏 Physical SPL calibration and dBFS modes
- ⚡ Vectorized multichannel processing and stateful block (real-time) workflows
pip install phonometryOptional extras: phonometry[plot] (matplotlib for response plots), phonometry[perf] (numba for faster impulse ballistics), phonometry[full] (both).
Full documentation website: https://jmrplens.github.io/phonometry/ (English / Español)
Or browse the Markdown docs on GitHub:
| Page | Contents |
|---|---|
| Getting Started | Installation, first analysis, WAV files |
| Filter Banks | Architectures, response gallery, band decomposition, zero-phase |
| Frequency Weighting | A/C/Z curves, class 1 high-accuracy mode |
| Time Weighting | Fast/Slow/Impulse ballistics, initial state |
| Levels | Leq, LAeq, L10/L50/L90, octave spectrogram |
| Calibration and dBFS | Physical SPL, digital full-scale, RMS vs peak |
| Block Processing | Stateful streaming workflows |
| Multichannel | Vectorized multichannel analysis, performance |
| API Reference | Every public function and class |
| Theory | Standards, math, design decisions |
| Why phonometry | IEC compliance verification vs other libraries |
import numpy as np
from phonometry import octavefilter

fs = 48000
t = np.linspace(0, 1, fs, endpoint=False)
# Composite signal: 100Hz + 1000Hz
signal = np.sin(2 * np.pi * 100 * t) + np.sin(2 * np.pi * 1000 * t)

# Apply 1/3 octave filter bank
spl, freq = octavefilter(signal, fs=fs, fraction=3)

print(f"Bands: {freq}")
print(f"SPL [dB]: {spl}")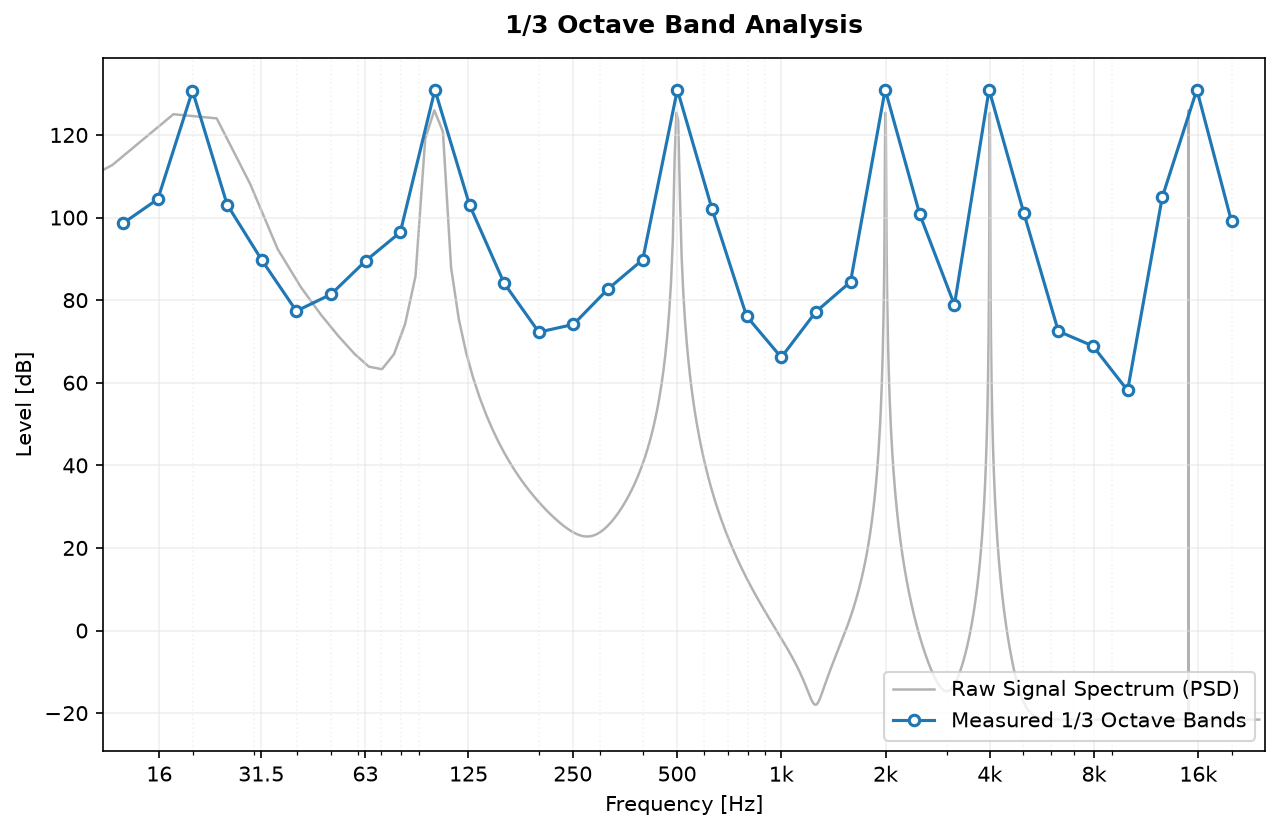
1/3 Octave Band spectrum analysis of a complex signal. More examples in the documentation.
make install   # dependencies + editable install
make check     # ruff + mypy + bandit + tests
make graphs    # regenerate documentation images
See https://github.com/jmrplens/phonometry/blob/main/CONTRIBUTING.md and the https://github.com/jmrplens/phonometry/blob/main/CHANGELOG.md