NOC Servers Dashboard
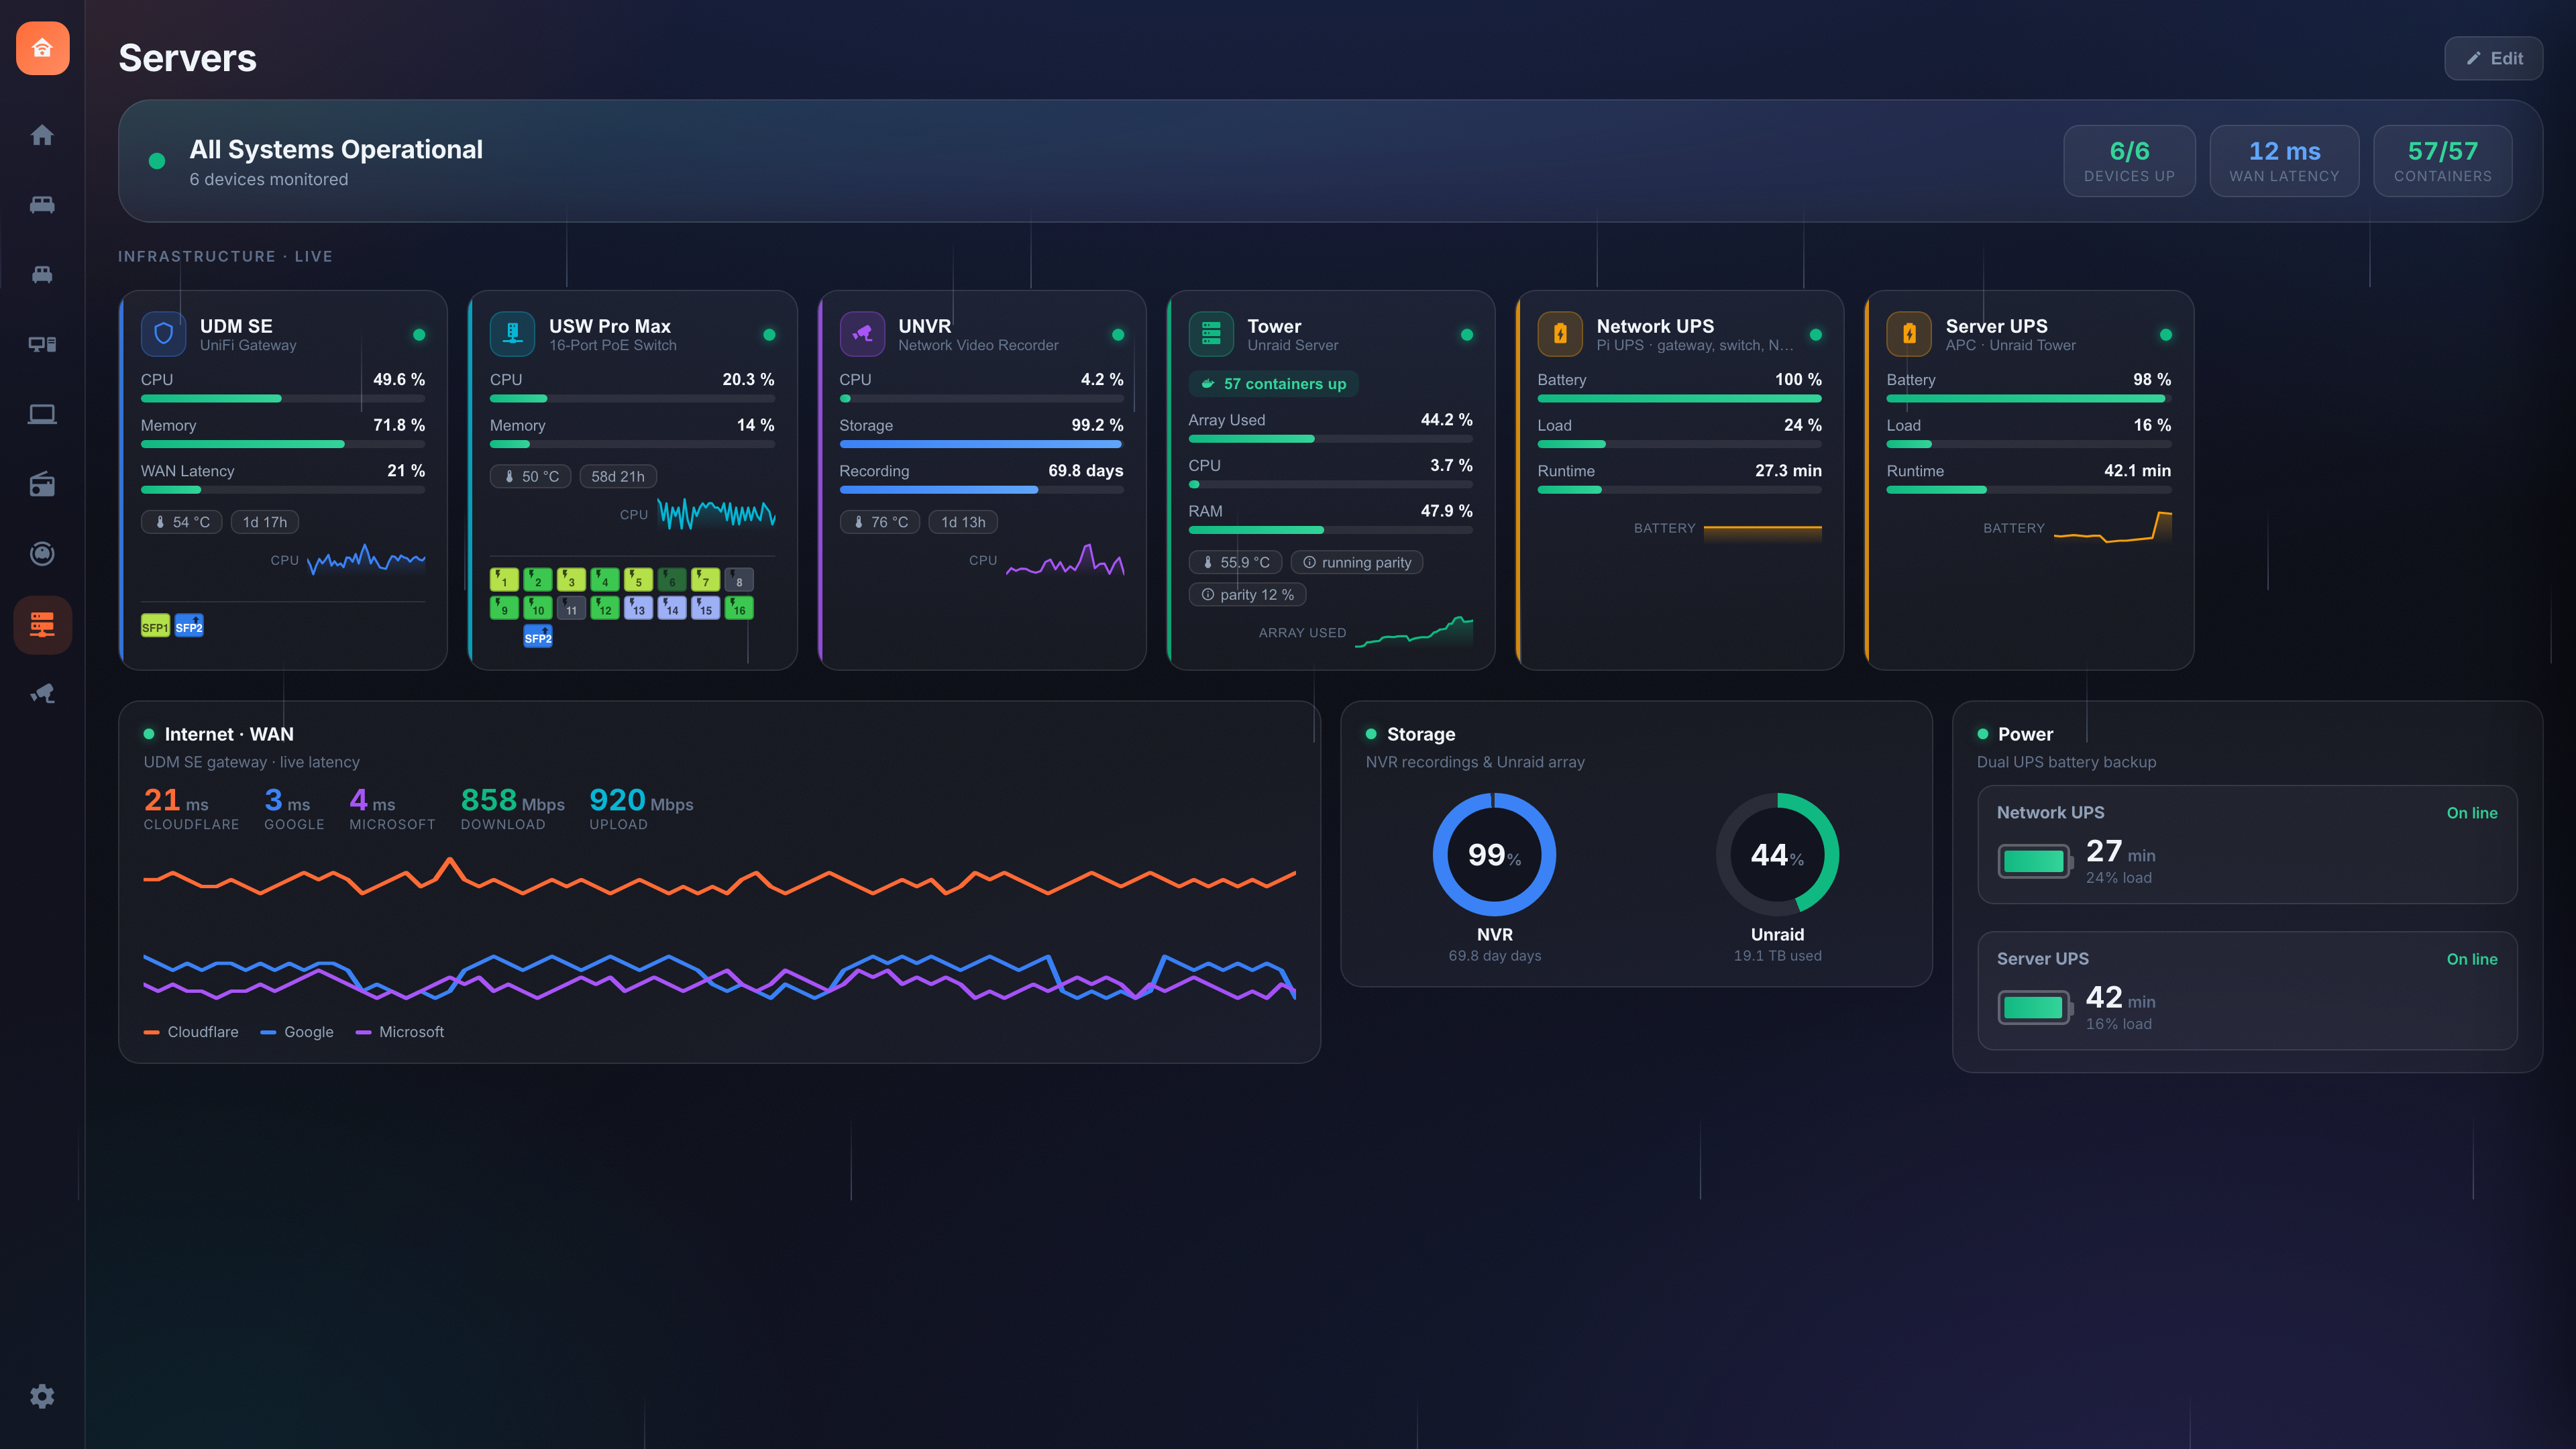
Glance pages come in board types. Most pages are the regular dashboard view (rooms, tiles and cards for controlling lights, locks, climate, media, etc.). The NOC (servers) board is a different kind of page built for monitoring infrastructure at a glance — servers, gateways, switches, NVRs, UPSes, Docker containers and internet/storage/power health.
| Regular view (Tiles / Sensor graphs / Cameras / Media) | NOC (servers) view | |
|---|---|---|
| Purpose | Control devices — tap to toggle, dim, set, play | Monitor infrastructure — read status at a glance |
| Building block | Entity tiles you place and drag | Device nodes (a server/switch/UPS) each bundling several sensors |
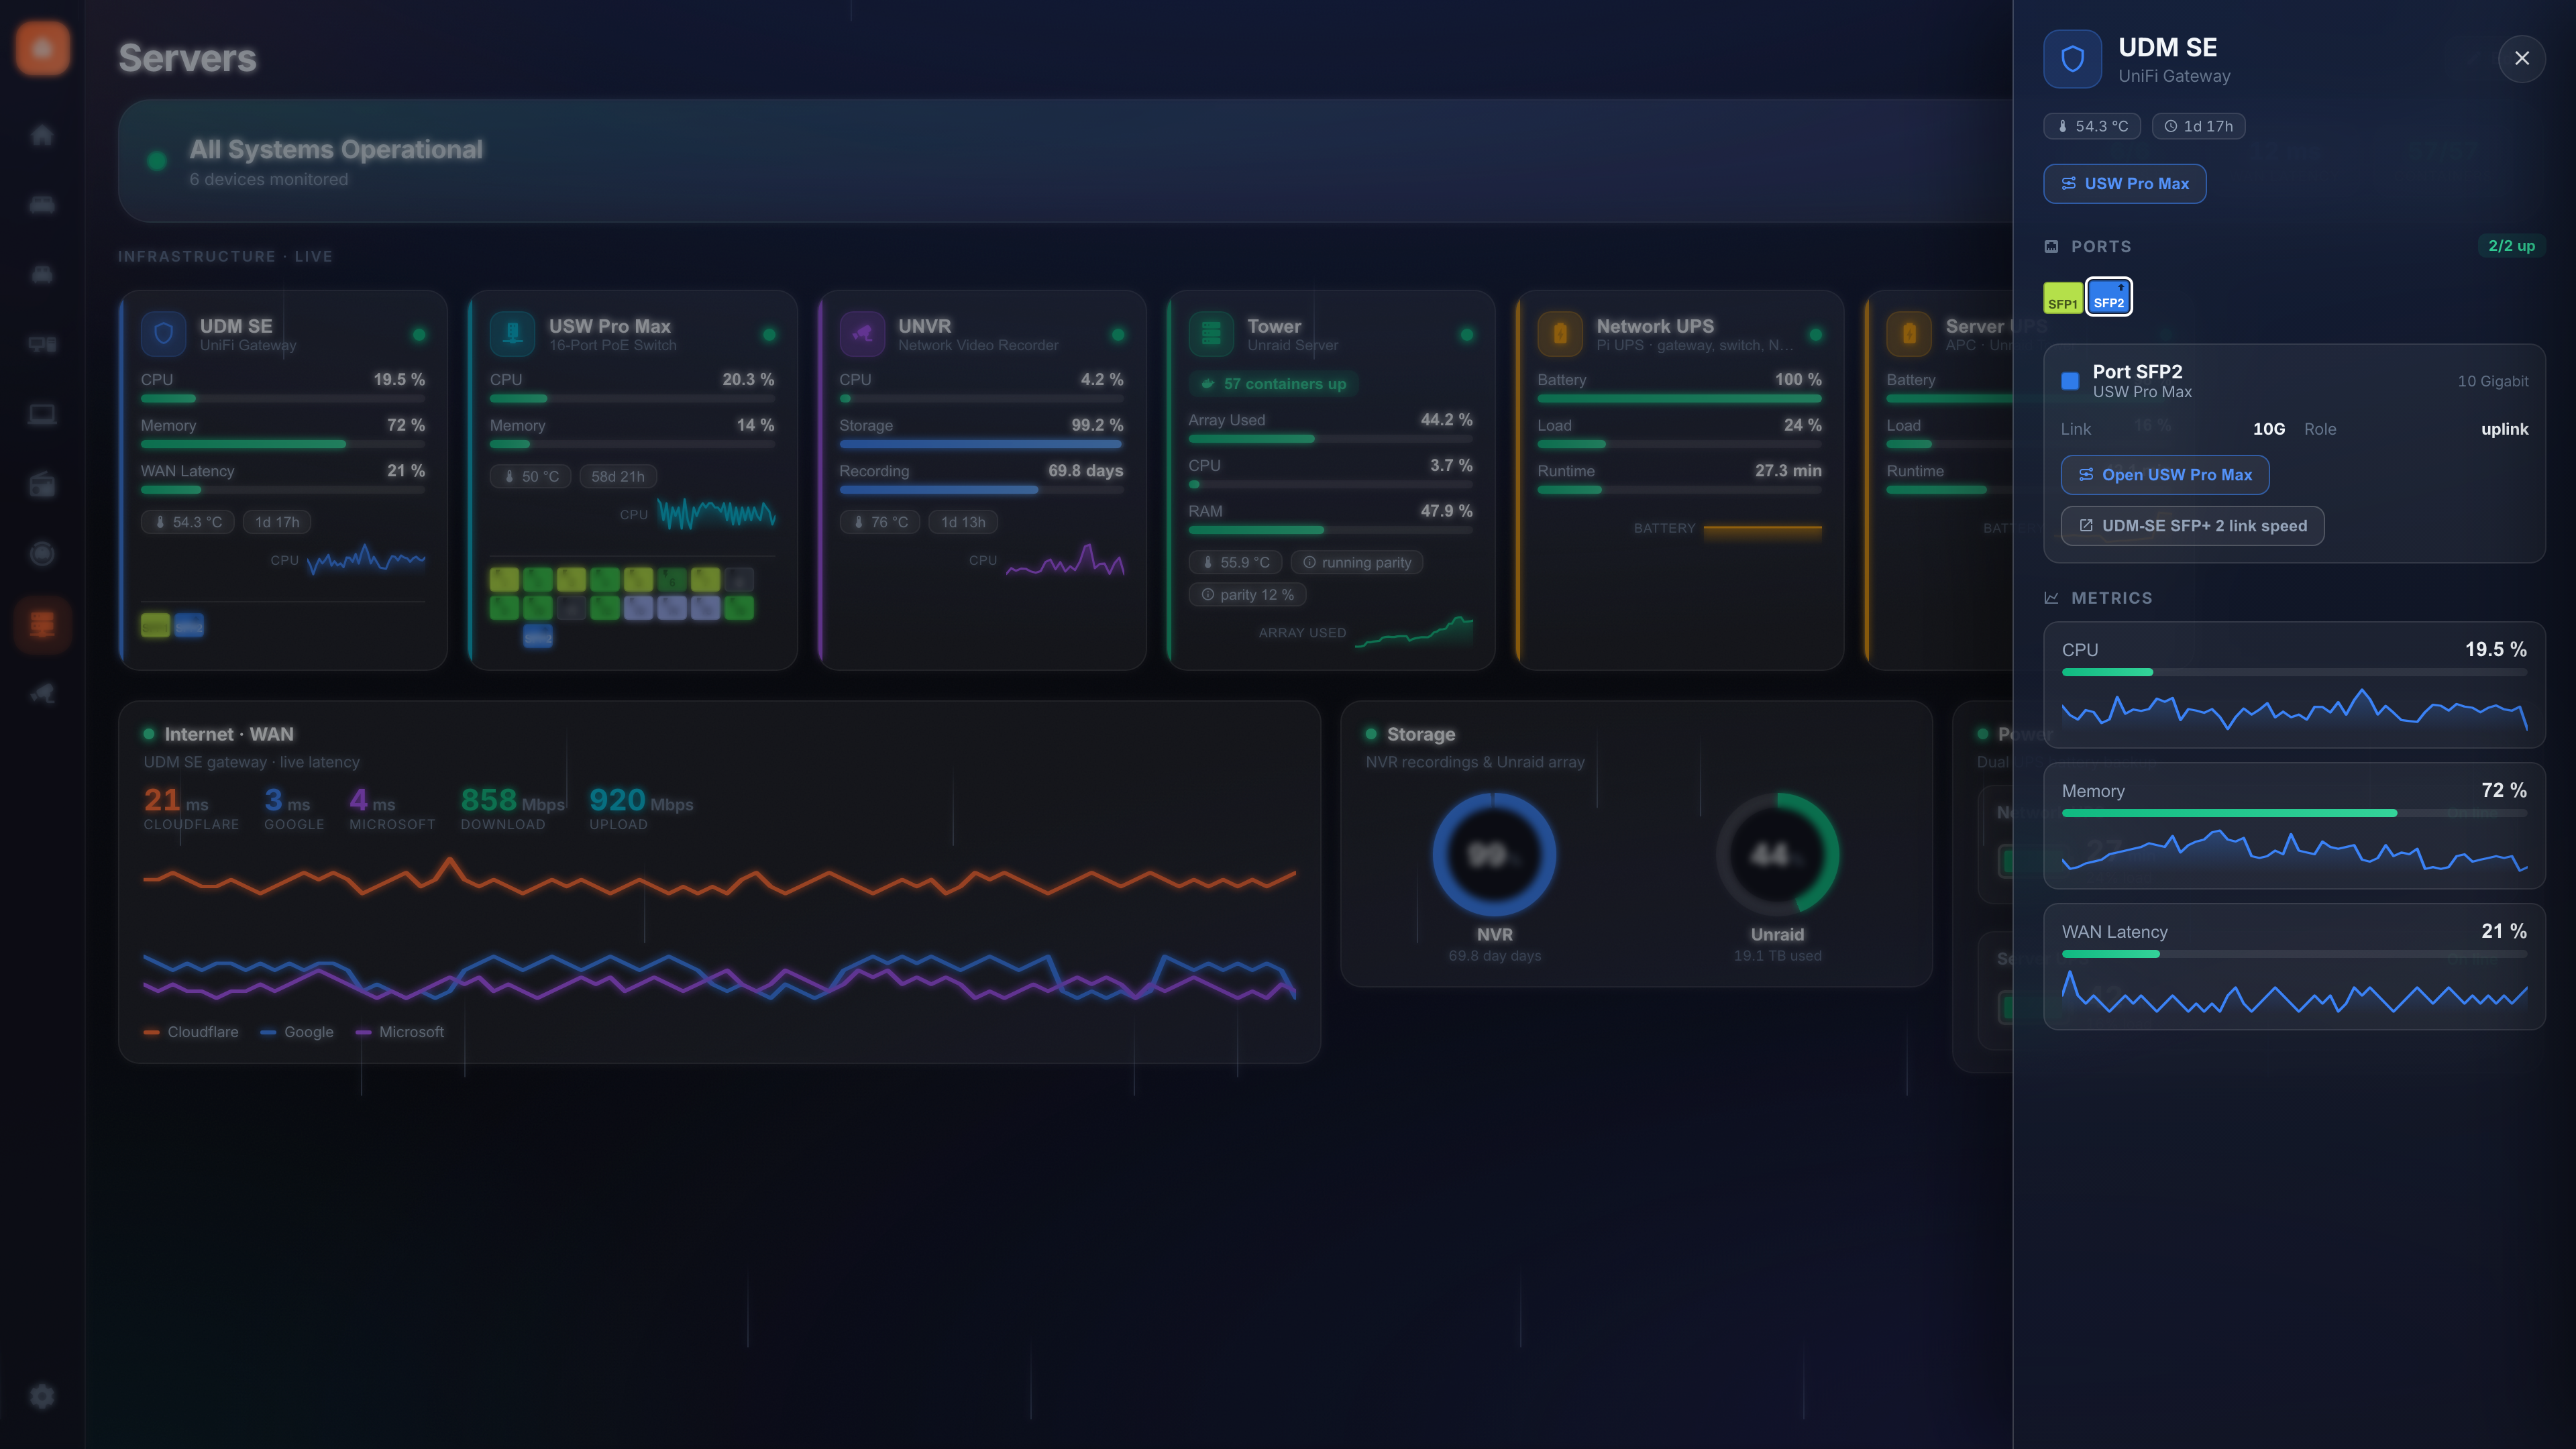
| Interaction | Tap a tile to actuate; long-press / flyout for detail | Tap a node to open a read-only flyout with metrics, containers & history |
| Top of page | Greeting + weather + people header | A live status banner ("All Systems Operational" / "N devices need attention") with summary chips, plus the same header (which you can hide) |
| At-a-glance | Glance strip (lights on, who's home…) | Per-node threshold bars, status LED, alert chips, a mini sparkline, and bottom Internet / Storage / Power panels |
| Alerts | None (it's a control surface) | Threshold warn/crit colors, status-keyword alerts (e.g. a UPS "Replace Battery"), and container-down detection that rolls up into the banner |
| Underlying kind | kind: 'tiles' | 'sensors' | 'cameras' | 'media' |
kind: 'sensors' with a noc config attached
|
Under the hood a NOC page is just a sensor page that has a
nocconfig. The board-type selector flips this for you — you never edit JSON.
- Enter Edit mode (pencil) and open Manage Pages (or Settings → Manage Pages).
- On the page you want, use the board-type dropdown and choose NOC (servers). (The same dropdown offers Tiles, Sensor graphs, Cameras and Now Playing — switching back to Tiles restores a normal control page.)
- Optionally hide the greeting / weather / people header widgets for that page with the three header toggles next to the dropdown — handy for a clean, wall-mounted NOC screen. This is per page, so your other pages keep their header.
Everything below is done in the app's Edit mode — nothing is hardcoded, and every node, metric, pill, panel and chip is user-creatable and editable.
- Auto-detect (optional head start). On an empty NOC page, click Auto-detect to scaffold nodes from sensors it recognizes (UPS, gateway, storage…). You can then edit or delete anything it guessed.
-
Add a device node. Click + Add Device. Give it a name, subtitle,
an icon (any
mdi-…class or a single emoji) and an accent color (drives its LED, bars and sparkline). -
Add metrics. Each metric points at one sensor and renders a labeled
threshold bar. Set unit, max (full-scale), and warn/crit
thresholds. Toggle:
- Lower = bad — inverts the comparison for metrics where less is worse (battery %, runtime, free space).
- Info only — show the gauge but never raise an alert (e.g. an NVR's continuous-recording disk that's designed to sit near-full, so a full disk isn't really an alert).
- Tile vs. Graph — mark up to 3 metrics as primary to show on the compact tile; the rest live in the flyout.
- Pick the sparkline metric. Each tile draws one mini sparkline; choose which metric it tracks (e.g. CPU vs. throughput vs. battery charge). A small key under the spark labels what it's showing.
-
Add pills & reachability. Optional footer pills (ports, cameras, parity,
power draw, uptime…) — each is an entity with an icon/label/unit. Optionally set
a temperature and uptime/info entity, and a reachability
(
binary_sensor) that marks the node up/down. Dates & uptime are formatted automatically: a sensor that reports a boot timestamp (e.g. an "UNVR Uptime" that reads2026-06-04T13:23:00+00:00) is shown as elapsed uptime ("1d 7h"), a duration counter as "3d 4h 23m", and any other timestamp as a real date in your browser's timezone. Per pill (and per node's uptime) you can override the mode — Auto, Elapsed/uptime, Date+time, Date, Time, Duration or Raw. The date pattern (e.g.MM/DD/YY · 12-hour) and duration style (3d 4h 23mvs.3:04:23:24) are picked once in Settings → Appearance. -
Status-keyword alerts. When a node has a status entity (e.g. a UPS NUT
status sensor), add comma-separated Critical and Warning keywords. If the
status text contains one (case-insensitive), the node shows a colored alert chip.
Real-world UPS example: Critical =
replacement, alarm, on battery, low battery, overload; Warning =bypass, boost, trim, calibrat, discharg. This is what surfaces a failing battery's "Battery Needs Replacement" flag. -
Watch Docker containers (server nodes). Point a node at container
switch/binary_sensorentities (or Add all running matching the node name). Any watched container that isn't running raises a node alert and bumps the banner's Containers chip. -
Bottom panels. Add Internet / WAN, Storage and Power panels at
the page bottom — all editable:
-
Internet/WAN — named stat numbers + a charted latency series, plus
external API stats (e.g. pull download/upload from a Speedtest-Tracker
container's JSON API: give it the URL, optional bearer token, a dotted JSON
path, unit and a multiplier like
1e-6for bits→Mbps). -
Storage — capacity rings; add a sublabel sensor and a suffix
(
used/free) so a "19.1 TB" reading is never ambiguous. - Power — UPS gauges (battery %, runtime, load, draw, status).
-
Internet/WAN — named stat numbers + a charted latency series, plus
external API stats (e.g. pull download/upload from a Speedtest-Tracker
container's JSON API: give it the URL, optional bearer token, a dotted JSON
path, unit and a multiplier like
-
Switch ports (port map). Switch nodes can show a UniFi-style port strip
along the bottom of the tile — each port a cell color-coded by link speed
(FE / GbE / 2.5G / 5G / 10G / SFP / SFP+, plus Disconnected and Disabled),
with a PoE lightning badge and uplink/aggregate/mirror role glyphs. In the
builder, add ports individually or in bulk (+8 / +24) — or hit
Auto-detect ports to map the whole switch in one click. It reads the live
UniFi entities, shows every physical port (including disconnected ones)
up to the switch's port count, names each active port after its connected
client, sets its live link speed/color, and binds the per-port
power-cycle button + PoE switch automatically. SFP / SFP+ ports are
detected and set off from the RJ45 bank by a one-port gap, just like a real
switch faceplate. A port's color comes from a manual speed dropdown, or bind
a live Mbps sensor to drive it automatically; bind a connectivity
entity to flip it to Disconnected when the link drops. Bind the PoE switch
entity (Home Assistant's UniFi integration exposes
switch.<device>_port_<N>_poe) to unlock, in the node's flyout, a per-port PoE on/off toggle and a Power-cycle action (turns PoE off, waits the configurable cycle seconds, then back on — handy for rebooting a stuck AP or camera). On UniFi gear it prefers the integration's dedicatedbutton.<…>_power_cyclewhen present. Tap any cell in the flyout to see its details; the Open in HA button (labelled with the entity's name) jumps to that port's underlying entity in Home Assistant for its full history and attributes.- Link a port to another device. Give any port (e.g. an SFP+ uplink) a → link to another NOC node. The port's flyout then shows an Open <device> jump button, and the target node's flyout automatically shows a jump back — no need to configure both ends. Great for hopping between a switch and the gateway it uplinks to.
- Banner chips. The summary chips (Devices Up, WAN latency, Clients, Containers) are configurable; add a custom entity chip for anything else.
All of this is saved in your backup. Every port — its speed/color, client name, PoE/power-cycle/speed/link entity bindings, role, and node-to-node link — lives inside the page config and is included when you export your layout (and restored on import). See Layout: Backup & Restore.
The NOC builder shows a live preview of each device tile right next to its form. As you type a name, change thresholds, pick a sparkline metric or add a pill, the preview tile updates instantly — no need to save, switch out of edit mode to verify, then come back. (On narrow screens the preview drops below the form.)
See also: Features · Configuration · Layout: Backup & Restore.