This project demonstrates advanced data analysis, API integration, and visualization techniques using Python. The two core scripts, Weather.py and Vacation.py, showcase proficiency in data acquisition, transformation, and interactive visualization, making this a valuable addition to a data science or software engineering portfolio.
- Data Acquisition: Fetches real-time weather data via OpenWeatherMap API.
- Data Transformation: Cleans and structures data for analysis.
- Statistical Analysis: Computes linear regression to analyze correlations.
- Visualization: Uses Matplotlib to generate meaningful weather plots.
- Python
- Pandas, NumPy, SciPy (Data manipulation & analysis)
- Requests (API integration)
- Matplotlib (Data visualization)
- Citipy (Geolocation processing)
- API Key: Obtain an OpenWeatherMap API key and store it in
api_keys.pyasweather_api_key. - Install Dependencies:
pip install matplotlib pandas numpy requests scipy citipy
- Run the Script: The script generates random latitude and longitude coordinates to identify unique cities using the
citipylibrary.
Below are sample outputs from Weather.py:
. Humidity Levels Across Locations

- Filtering & Decision Making: Selects vacation destinations based on ideal weather conditions.
- API Integration: Retrieves hotel data using the Geoapify API.
- Interactive Visualization: Uses hvPlot for mapping locations dynamically.
- Python
- Pandas (Data manipulation)
- Requests (API integration)
- hvPlot (Interactive visualization)
- API Key: Obtain a Geoapify API key and insert it in the script.
- Install Dependencies:
pip install pandas requests hvplot
- Run the Script:
python Vacation.py
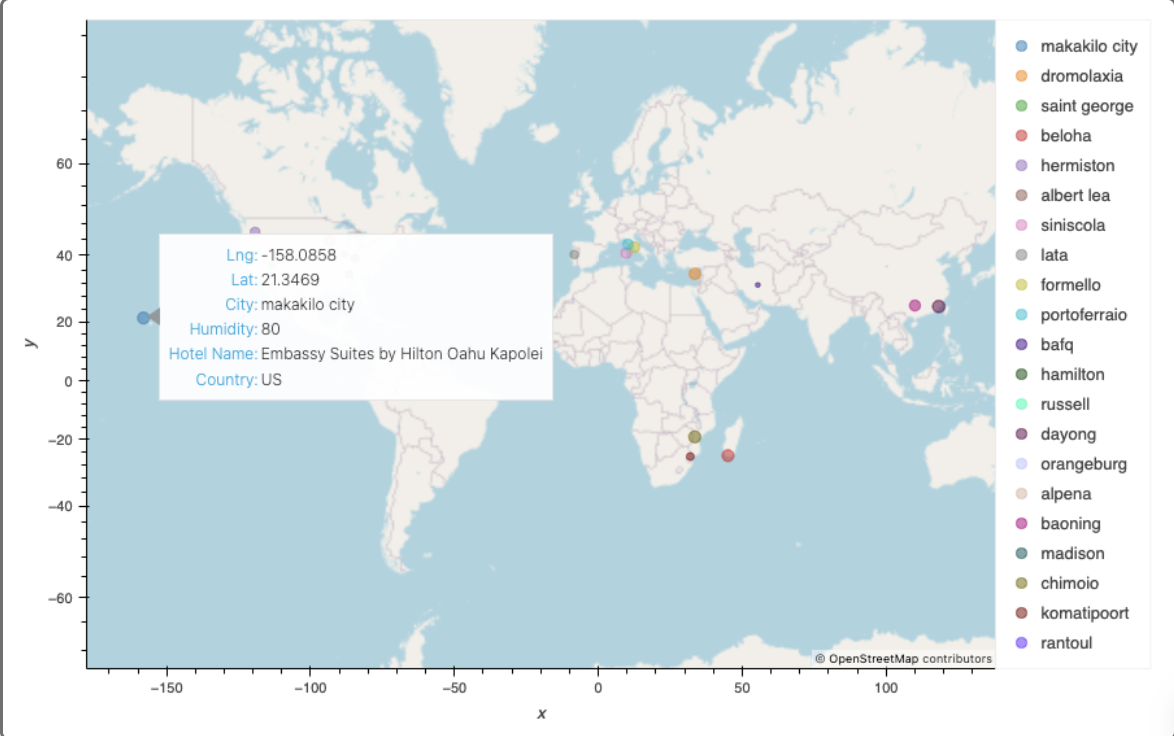
Below are the visualizations generated by Vacation.py:
. Cities with Nearby Hotels
import matplotlib.pyplot as plt
import pandas as pd
import numpy as np
import requests
import time
from scipy.stats import linregress
from api_keys import weather_api_key
from citipy import citipy

# Generate list of cities
lat_lngs = [(lat, lng) for lat, lng in zip(np.random.uniform(-90, 90, size=1500), np.random.uniform(-180, 180, size=1500))]
cities = list(set(citipy.nearest_city(lat, lng).city_name for lat, lng in lat_lngs))

# Fetch weather data
city_data = []
for city in cities:
    city_url = f"http://api.openweathermap.org/data/2.5/weather?q={city}&appid={weather_api_key}&units=metric"
    try:
        city_weather = requests.get(city_url).json()
        city_data.append({
            "City": city,
            "Lat": city_weather["coord"]["lat"],
            "Lng": city_weather["coord"]["lon"],
            "Max Temp": city_weather["main"]["temp_max"],
            "Humidity": city_weather["main"]["humidity"],
            "Cloudiness": city_weather["clouds"]["all"],
            "Wind Speed": city_weather["wind"]["speed"],
            "Country": city_weather["sys"]["country"],
            "Date": city_weather["dt"]
        })
    except:
        pass
    time.sleep(1)

# Save and read data
city_data_df = pd.DataFrame(city_data)
city_data_df.to_csv("cities.csv", index_label="City_ID")
city_data_df = pd.read_csv("cities.csv", index_col="City_ID")import pandas as pd
import requests
import hvplot.pandas
# Load filtered city data
city_data_df = pd.read_csv('filtered_city_data.csv')
# Create hotel DataFrame
hotel_df = city_data_df.copy()
hotel_df['Hotel Name'] = ""
# Geoapify API parameters
api_key = "YOUR_GEOAPIFY_API_KEY"
radius = 10000
params = {
"categories": "accommodation.hotel",
"limit": 1,
"apiKey": api_key
}
# Find hotels
for index, row in hotel_df.iterrows():
lat = row["Lat"]
lng = row["Lng"]
params["filter"] = f"circle:{lng},{lat},{radius}"
params["bias"] = f"proximity:{lng},{lat}"
base_url = "https://api.geoapify.com/v2/places"
response = requests.get(base_url, params=params)
name_address = response.json()
try:
hotel_df.loc[index, "Hotel Name"] = name_address["features"][0]["properties"]["name"]
except (KeyError, IndexError):
hotel_df.loc[index, "Hotel Name"] = "No hotel found"
# Plot data
map_plot = hotel_df.hvplot.scatter(
x="Lng",
y="Lat",
size="Humidity",
color="Humidity",
hover_cols=["City", "Country", "Hotel Name"],
title="Cities and Nearby Hotels",
xlabel="Longitude",
ylabel="Latitude"
)
map_plot- API Errors: Ensure API keys are valid and correctly inserted.
- Data Issues: Verify data files are generated and paths are correctly set.
- Showcases Full-Stack Data Processing: From API data retrieval to visualization.
- Demonstrates Analytical Thinking: Statistical analysis and filtering logic.
- Utilizes Modern Visualization Techniques: Interactive mapping with hvPlot.
This project exemplifies my ability to handle real-world data challenges, integrating APIs and leveraging Python’s analytical power to deliver insightful visualizations.