Weather data analysis and visualization using API calls, charts, and map layers.
This Python script (WeatherPy.ipynb) is used to visualize the weather of 1,500 cities across the world of varying distance from the equator, using data from the OpenWeatherMap API. The goal is to visualize weather trends in cities at varying distances from the equator.
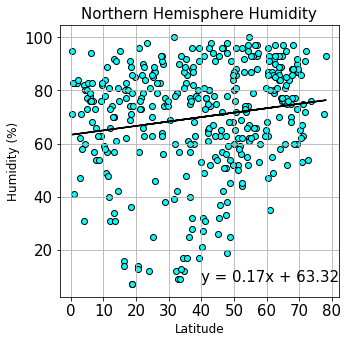
Citipy is used to generate a list of 1,500 cities from randomly selected latitude and longitude coordinates, then API calls are used to collect the weather data for each city. Matplotlib and scipy.stats are used to plot and model the relationship between latitude and four weather parameters (temperature, humidity, cloudiness, windspeed) for cities in the northern and southern hemispheres. Images of each plot (with and without regression lines) and a CSV file of the generated dataset (city_data.csv) are stored in the Outputs directory.


This Python script (VacationPy.ipynb) uses jupyter-gmaps and the Google Places API to create a heat map that displays the humidity for cities in the WeatherPy dataset, and pins that provide hotel information for cities with "ideal" vacation weather.
The WeatherPy dataframe is imported into the Jupyter Notebook file (VacationPy.ipynb) from the Outputs directory (city_data.csv). Using gmaps, a map is created with the latitude and longitude coordinates for each city, and heatmap layer displaying humidity data is added. A new dataframe containing cities with "ideal weather" (temperature 70-80 degrees F, windspeed < 10 mph, 0 cloudiness) is created and the Google Places API is used to find the first hotel for each city located within 5000 meters of each city coordinate. A marker layer is added to the map, with pins that list hotel name, city, and country.

- Jupyter Notebook
- Python
- Pandas
- Matplotlib
- NumPy
- citypy
- scipy.stats
- Clone this repository to your desktop.
- Create an api_keys Python file to store your API keys:
- weather_api_key = "YOUR KEY HERE"
- g_key = "YOUR KEY HERE"
- Navigate to the home directory and run the VacationPy.ipynb and WeatherPy.ipynb files in Jupyter Notebook.
- OpenWeatherMap API Access Data
- Google Places API Access Data
Katlin Bowman, PhD