A powerful plugin for Obsidian that allows you to create JSON-defined tables with spreadsheet-like editing capabilities and render interactive 2D Plotly charts directly in your notes.


- Spreadsheet-like Editor: Edit tables in a dedicated modal with support for row/column manipulation.
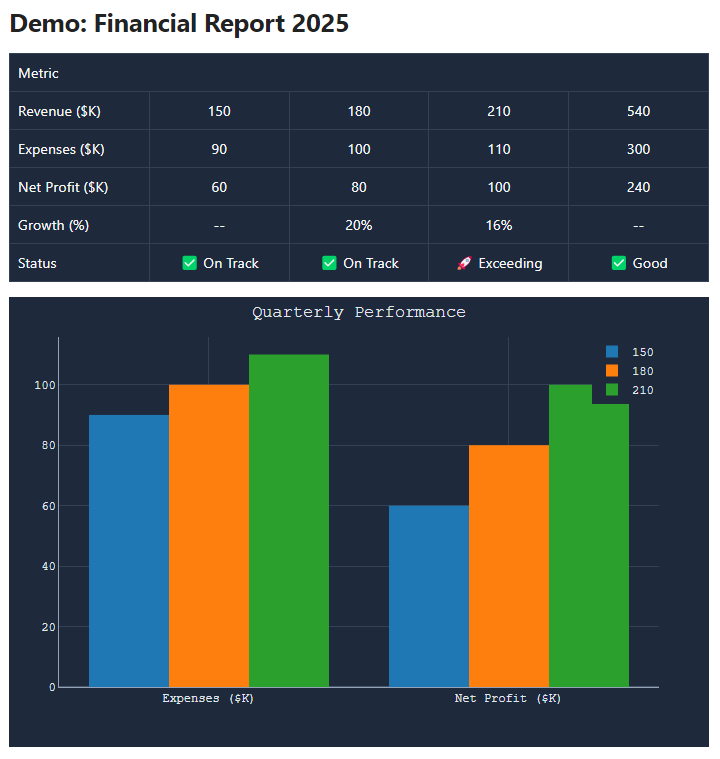
- Interactive 2D Plots: Create charts using a lighter Plotly cartesian bundle directly from your table data. Supports Scatter, Line, Bar charts, Linear Regression, and configurable PNG/SVG downloads.
- Data Manipulation: Merge/Unmerge cells, drag-and-drop row/column reordering, and paste data from Excel/CSV/TSV.
- Customizable View: Toggle headers, adjust width/margins, scale to fit, and apply themes (Striped, Academic, Blueprint, etc.).
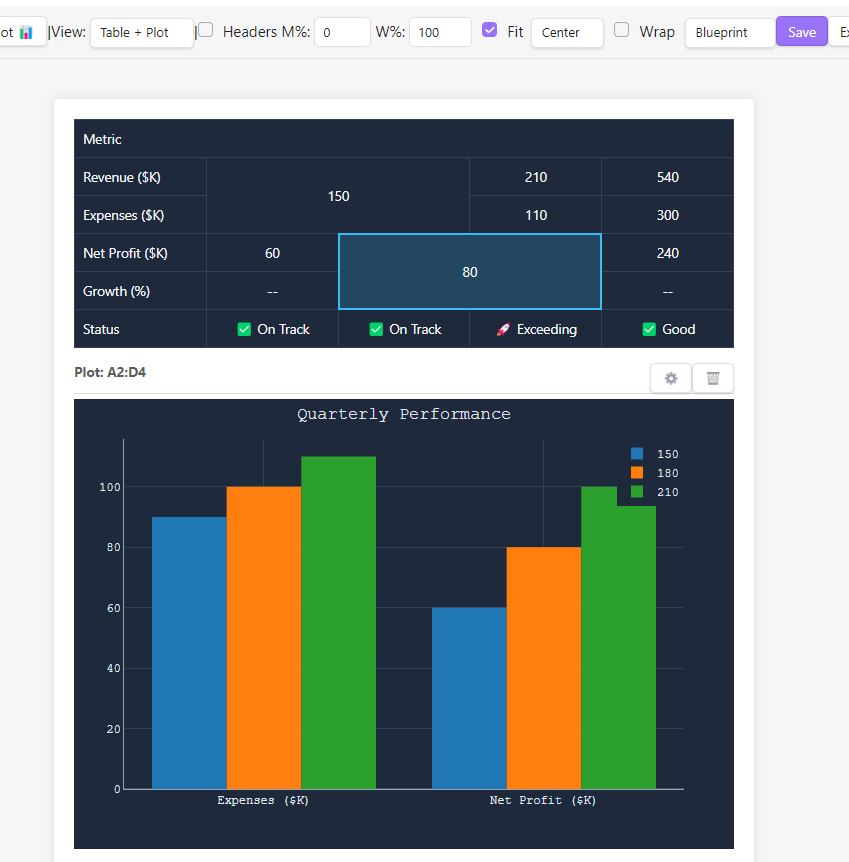
Edit your data comfortably with a spreadsheet interface. Supports cell merging, drag-and-drop for rows/columns, and bulk actions.
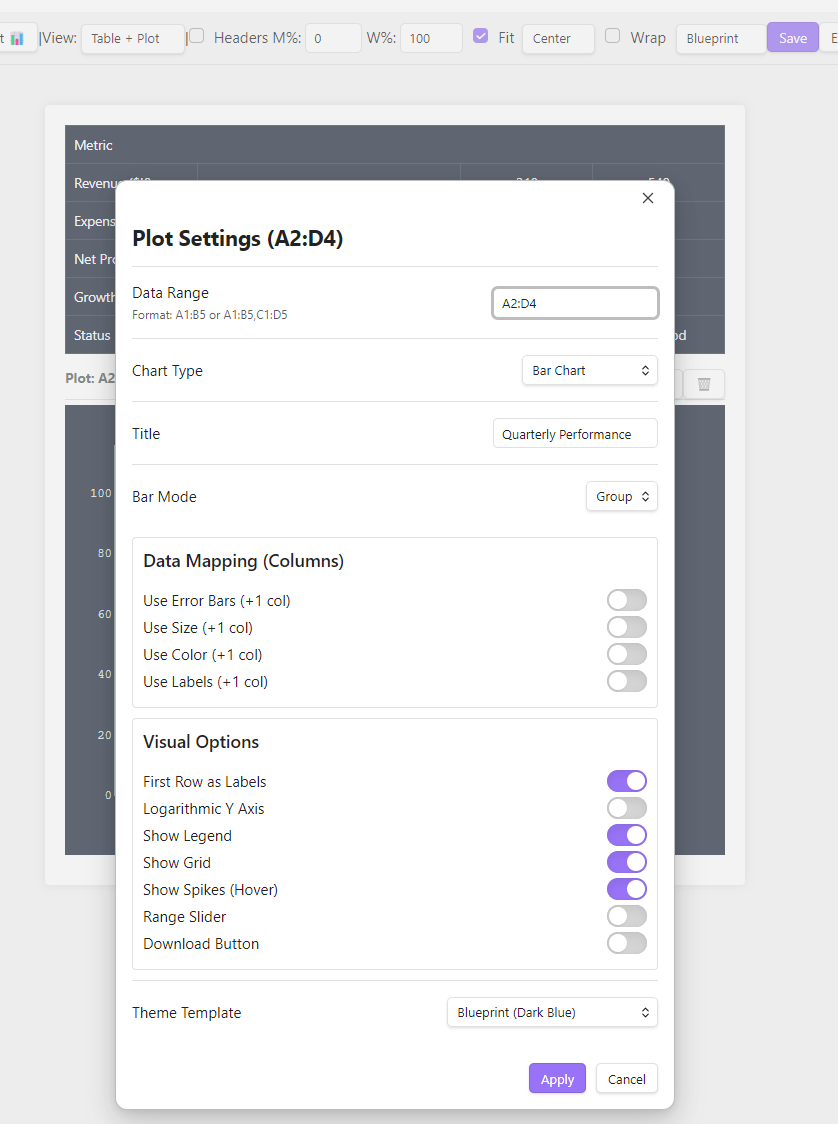
Configure your charts with precision. Choose chart types, map columns to X/Y axes, add error bars, customize colors, and apply visual templates (e.g., Blueprint, Academic). The bundled Plotly build is optimized for supported 2D/cartesian charts.
This plugin is designed for Desktop use. The complex UI (drag-and-drop, resizing, modal editor) is not optimized for mobile touchscreens.
You can try a browser-based version of the editor here to see the core functionality in action: 👉 Live Demo (Note: The web demo might be slightly outdated compared to the Obsidian plugin)
- Create a code block with
simpletable. - Paste one of the examples below or start with an empty object
{}. - Click the "Edit ✏️" button in the top-right corner of the rendered block.
- Use the modal editor to modify data and configure plots visually.
- Click Save.
For vault safety, a table is limited to 500 rows, 100 columns, 20,000 cells, and 20 plots. CSV/TSV paste is supported, but multiline quoted fields are not supported yet.
The Plotly modebar download button can export charts as PNG or SVG. Configure the export width and format in the plugin settings. SVG export is useful for HTML export workflows and vector-friendly copy/paste pipelines.
Cells support simple inline formatting only: **bold**, *italic*, ~~strike~~, ~sub~, and ^sup^. Nested inline formatting is not supported.
The plugin provides commands to quickly insert templates (accessible via Ctrl/Cmd + P):
Simple Table: Insert Basic Table: Inserts a 3x3 table template.Simple Table: Insert Plotly Chart: Inserts a standalone Plotly chart template.
You can define a table using simple JSON. The | character separates columns. Escape literal pipes inside cells as \|.
```simpletable
{
  "rows": 3,
  "cols": 2,
  "cells": [
    "Item|Cost ($)",
    "Apple|1.50",
    "Banana|0.80"
  ]
}
```
Render supported 2D Plotly charts without a visible table by setting "type": "plotly". The plugin uses plotly.js-cartesian-dist-min, so standalone JSON supports scatter, bar, box, contour, heatmap, histogram, histogram2d, histogram2dcontour, image, pie, scatterternary, and violin. Full Plotly-only features such as 3D scenes, geo/maps, Mapbox, polar charts, WebGL trace types, Sankey, treemap, sunburst, table, indicator, and financial trace types are not included in this lighter bundle.
```simpletable
{
  "type": "plotly",
  "data": [
    {
      "x": [1, 2, 3, 4],
      "y": [10, 15, 13, 17],
      "type": "scatter",
      "mode": "lines+markers"
    }
  ],
  "layout": {
    "title": {
      "text": "My Simple Chart"
    },
    "height": 400
  }
}
```
Other Obsidian plugins can use this plugin as the source of truth for Plotly chart export instead of reimplementing simpletable parsing. The API can export rendered charts or source simpletable blocks to SVG/HTML, and can copy chart output to the clipboard with HTML/SVG and optional PNG fallback payloads.
const plugin = (this.app as any).plugins.getPlugin?.('simple-table-plot')
    ?? (this.app as any).plugins.plugins?.['simple-table-plot'];

const api = plugin?.api;

if (api?.version === 1) {
    const exported = await api.exportBlockToSvg(simpletableSource, {
        width: 1200
    });

    const html = exported.map(item => item.html).join('\n');
}
Available methods:
exportBlockToSvg(source, options)returns chart SVG and HTML wrappers for asimpletableblock.exportBlockToHtml(source, options)returns HTML with inline SVG figures.exportRenderedPlotToSvg(plotDiv, options)exports an already rendered Plotly element.exportRenderedPlotToHtml(plotDiv, options)wraps a rendered chart SVG in export HTML.copyBlockToClipboard(source, options)writes HTML/SVG clipboard payloads and can include PNG fallback for word processors.
Version 1.0.2 uses the plugin ID simple-table-plot to match the current Obsidian manifest requirements. If you installed an earlier manual or BRAT build in .obsidian/plugins/obsidian-simple-table/, disable it and delete that old folder before installing from Community Plugins or copying the new release files. Otherwise Obsidian can load the old and new copies side by side because they share the same visible plugin name.
- Open Obsidian Settings > Community Plugins.
- Turn off "Safe mode" if Obsidian asks you to do so.
- Click "Browse" and search for "Simple Table & Plot".
- Click Install and then Enable.
- Download
main.js,manifest.json, andstyles.cssfrom the Releases page. - Create a folder
simple-table-plotinside.obsidian/plugins/in your vault. - Move the downloaded files into that folder.
- Reload Obsidian and enable the plugin.
- Added configurable SVG downloads for Plotly charts.
- Added a public SVG/HTML/clipboard export API for other plugins.
- Updated the lightweight Plotly cartesian bundle to
plotly.js-cartesian-dist-min3.5.1. - Added Plotly 3 layout title normalization for older notes.
- Plugin ID changed from
obsidian-simple-tabletosimple-table-plotfor the first Community Plugins submission. Pre-community users should remove the old.obsidian/plugins/obsidian-simple-table/folder before installing this release. - Plot numeric parsing is now strict. Values with non-numeric trailing characters such as units, currency symbols, or percent signs are no longer silently accepted as numbers.
- Spaces and non-breaking spaces inside numeric values are ignored, so values like
1 234.56can be parsed as1234.56.
MIT License. See LICENSE file for details.