First I would like to greet and thank you for the existence of the project. I was surprised that Java was a bit behind regarding Charting, graphing & plotting libraries.
Related to #404 it would be good to have this options available and change the color of a single Y-AxisGroupTitle.
I already did some adjustments and was able to reach the following effects:
1. LineChart03a - Extensive Chart Customization (Y-Axis Title color)

2. DateChart01a - Millisecond Scale with Two Separate Y Axis Groups (title & color)

- DateChart03a - Minute Scale with Two Separate Y Axis Groups (titled & colored)
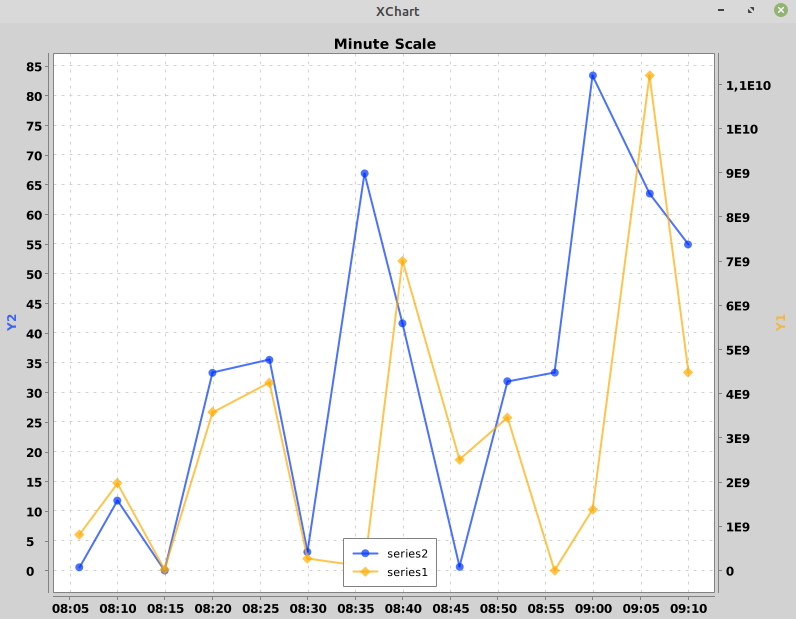
Regarding the 3rd Example the original Example: DateChart03 - Minute Scale with Two Separate Y Axis Groups has a problem which I think should be described in a separate Issue too. Its Lable is misleading since the series are created in a mixed order, which seems to be critical. At lines:
|
chart.addSeries("series1", xData1, yData1).setYAxisGroup(1); |
|
chart.addSeries("series2", xData2, yData2); |
It still assigns the
first-default color to the first created series, which happened to be the second
series 2 series (Or just the Label - not quite sure which occurs first and if it just assigns the first series color to the second label). That way the
series and
label colors defer. It took a while to figure it out, but that just proves the reasoning of the
Color-Issue.
In a second post bellow I will extend the writing and give details to the API-changes and will try to prepare a pull request.
First I would like to greet and thank you for the existence of the project. I was surprised that Java was a bit behind regarding Charting, graphing & plotting libraries.
Related to #404 it would be good to have this options available and change the color of a single
Y-AxisGroupTitle.I already did some adjustments and was able to reach the following effects:
1. LineChart03a - Extensive Chart Customization (Y-Axis Title color)

2. DateChart01a - Millisecond Scale with Two Separate Y Axis Groups (title & color)

Regarding the 3rd Example the original Example: DateChart03 - Minute Scale with Two Separate Y Axis Groups has a problem which I think should be described in a separate
Issuetoo. ItsLableis misleading since the series are created in a mixed order, which seems to be critical. At lines:XChart/xchart-demo/src/main/java/org/knowm/xchart/demo/charts/date/DateChart03.java
Line 77 in b800f66
XChart/xchart-demo/src/main/java/org/knowm/xchart/demo/charts/date/DateChart03.java
Line 78 in b800f66
It still assigns the
first-default color to the first created series, which happened to be the secondseries 2series (Or just the Label - not quite sure which occurs first and if it just assigns the first series color to the second label). That way theseriesandlabelcolors defer. It took a while to figure it out, but that just proves the reasoning of theColor-Issue.In a second post bellow I will extend the writing and give details to the API-changes and will try to prepare a pull request.