A stunning 3D interactive visualization tool for exploring code relationships and dependencies. Built with Three.js and 3d-force-graph.

Click the image above to watch the demo video on YouTube
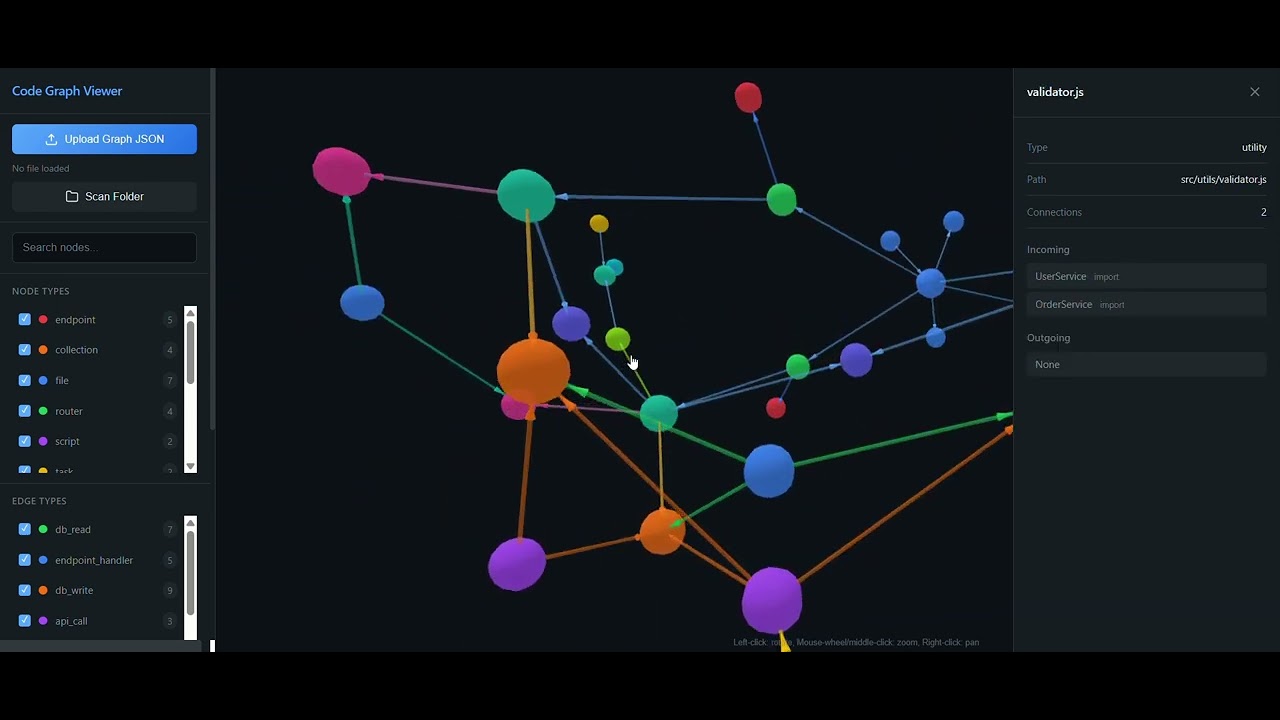
- 🎮 3D Interactive Graph - Rotate, zoom, and pan with mouse controls
- 🔍 Search & Filter - Find nodes by name, filter by type
- 📊 Multiple Node Types - 12 distinct node types with unique colors
- 🔗 Edge Visualization - 11 relationship types with directional arrows
- 📋 Detail Panel - Click nodes to see connections and metadata
- 📁 Codebase Scanner - Analyze folders and auto-generate graphs
- 📤 Export Options - Save as PNG, SVG, or JSON
Simply visit the live demo: https://koshibaharuki.github.io/code-graph-viewer
# Clone the repository
git clone https://github.com/koshibaharuki/code-graph-viewer.git
cd code-graph-viewer

# Serve with any static file server
npx serve .

# Open http://localhost:3000| Action | Control |
|---|---|
| Rotate | Left-click + drag |
| Zoom | Mouse wheel |
| Pan | Right-click + drag |
| Select node | Click on node |
| Close detail | Click ✕ or background |
code-graph-viewer/
├── index.html          # Main HTML
├── css/
│   └── styles.css      # Dark theme styling
└── js/
    ├── app.js          # Main application logic
    ├── graph.js        # 3D visualization (Three.js)
    ├── scanner.js      # Codebase analyzer
    ├── exporter.js     # Export PNG/SVG/JSON
    └── utils.js        # Helper functions
| Type | Color | Description |
|---|---|---|
endpoint |
🔴 Red | API endpoints |
collection |
🟠 Orange | Database collections |
file |
🔵 Blue | Source files |
router |
🟢 Green | Route handlers |
script |
🟣 Purple | Scripts |
task |
🟡 Yellow | Background tasks |
cache_key |
💗 Pink | Cache keys |
service |
🩵 Teal | Services |
utility |
💜 Indigo | Utility modules |
webhook |
🌸 Rose | Webhooks |
event |
🟢 Lime | Events |
external_api |
🌊 Cyan | External APIs |
Upload your own graph data in JSON format:
{
  "nodes": [
    { "id": "1", "name": "app.js", "type": "file", "path": "src/app.js" },
    { "id": "2", "name": "UserService", "type": "service", "path": "src/services/UserService.js" }
  ],
  "edges": [
    { "source": "1", "target": "2", "type": "import" }
  ]
}import- Module importsdb_read/db_write- Database operationsapi_call- External API callsendpoint_handler- Route to endpoint mappingcache_read/cache_write- Cache operationswebhook_receive/webhook_send- Webhook connectionsevent_publish- Event publishing
- Three.js - 3D rendering
- 3d-force-graph - Force-directed graph
- html2canvas - PNG export
- Vanilla JavaScript, HTML5, CSS3
Contributions are welcome! Feel free to:
- Fork the repository
- Create a feature branch (
git checkout -b feature/amazing-feature) - Commit your changes (
git commit -m 'Add amazing feature') - Push to the branch (
git push origin feature/amazing-feature) - Open a Pull Request
This project is open source and available under the MIT License.
- Inspired by code visualization tools like Madge and Dependency Cruiser
- Built with ❤️ for the developer community
Star ⭐ this repo if you find it useful!