K-Prototype Clustering algorithm in an excel.
Clustering is very important statistical technique which is used to cluster the data based on different methods. While dealing with real time data, we will have both continuous variables and categorical variables. If we have only continuous variables, then we can go for k-means clustering algorithm to cluster the data. If we have only categorical variables in your data, then we can go for k-modes clustering algorithm to cluster the data. If we have both the variables types in the data, then k-means and k-modes doesn't applicable. We should use different algorithm to cluster such type of data. We have a good technique to tackle with such type of data called 'k-prototype clustering'. K-prototype clustering is nothing but the combination of both k-means and k-modes clustering.
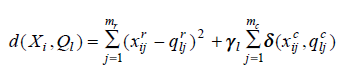
In the above formula, first part deals with continuous variables.
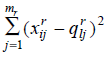
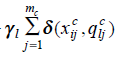
And the second part deals with categorical variables.
Here,
 is a weight for categorical attributes for cluster l.
In k-prototype clustering, we are calculating the distance based on different methods such as Euclidean distance, Manhattan distance, Mahalanobis distance, Chebechevs and minkowski distance.
Ex: Let us apply the above equation on the following data.
| A | B | C | D |
|---|---|---|---|
| 10 | 22 | 1 | 1 |
| 15 | 23 | 1 | 2 |
| 25 | 21 | 1 | 2 |
| 33 | 33 | 2 | 1 |
| 45 | 35 | 2 | 2 |
| 50 | 31 | 3 | 3 |
| 24 | 15 | 2 | 2 |
| 70 | 10 | 1 | 3 |
In the above data, A and B are continuous variables, C and D are categorical variables.
Step1:
Initially, we have to select 'k' number of records randomly from the data. Those selected records will be called as clusters.
| C1 | C2 | |||||||||||||||
|---|---|---|---|---|---|---|---|---|---|---|---|---|---|---|---|---|
| A | B | C | D | C1_T | A | B | C | D | C2_T | New_Cls | C1_T | C2_T | ||||
| A | B | C | D | 10 | 22 | 1 | 1 | 70 | 10 | 1 | 3 | |||||
| 10 | 22 | 1 | 1 | 0.0 | 0.0 | 0.0 | 0.0 | 0.00 | 3600.00 | 144.00 | 0.00 | 1.00 | 62.19 | 1 | 0.00 | 62.19 |
| 15 | 23 | 1 | 2 | 25.0 | 1.0 | 0.0 | 1.0 | 6.10 | 3025.00 | 169.00 | 0.00 | 1.00 | 57.52 | 1 | 6.10 | 57.52 |
| 25 | 21 | 1 | 2 | 225.0 | 1.0 | 0.0 | 1.0 | 16.03 | 2025.00 | 121.00 | 0.00 | 1.00 | 47.32 | 1 | 16.03 | 47.32 |
| 33 | 33 | 2 | 1 | 529.0 | 121.0 | 1.0 | 0.0 | 26.50 | 1369.00 | 529.00 | 1.00 | 1.00 | 45.57 | 1 | 26.50 | 45.57 |
| 45 | 35 | 2 | 2 | 1225.0 | 169.0 | 1.0 | 1.0 | 39.34 | 625.00 | 625.00 | 1.00 | 1.00 | 37.36 | 2 | 39.34 | 37.36 |
| 50 | 31 | 3 | 3 | 1600.0 | 81.0 | 1.0 | 1.0 | 43.00 | 400.00 | 441.00 | 1.00 | 0.00 | 30.00 | 2 | 43.00 | 30.00 |
| 24 | 15 | 2 | 2 | 196.0 | 49.0 | 1.0 | 1.0 | 17.65 | 2116.00 | 25.00 | 1.00 | 1.00 | 48.27 | 1 | 17.65 | 48.27 |
| 70 | 10 | 1 | 3 | 3600.0 | 144.0 | 0.0 | 1.0 | 62.19 | 0.00 | 0.00 | 0.00 | 0.00 | 0.00 | 2 | 62.19 | 0.00 |
In the above table, I selected first and last records as initial clusters. Base on those clusters, I calculated distance by using Euclidean and maximum distances.
Here A and B are continuous variables. So, we should use any one of above specified distance measure to calculate the distance.
C and D are categorical variables, So, we should calculate difference between the numbers. If they are same, we should flag them as 0 otherwise 1.
C1_T is the sum of all the distances in cluster 1(C1).
Similarly, we have to caluculate distances for Cluster 2.
| Sno. | A | B | C | D |
|---|---|---|---|---|
| 1 | 10 | 22 | 1 | 1 |
| 2 | 15 | 23 | 1 | 2 |
| 3 | 25 | 21 | 1 | 2 |
| 4 | 33 | 33 | 2 | 1 |
| 5 | 45 | 35 | 2 | 2 |
| 6 | 50 | 31 | 3 | 3 |
| 7 | 24 | 15 | 2 | 2 |
| 8 | 70 | 10 | 1 | 3 |
| C1 updates | 21.4 | 22.8 | 1 | 2 |
| C2 Updates | 55 | 25.33333 | #N/A | 3 |
Here 1,2,3,4 and 7th records are belonging to cluster 1 and 5,6 and 8th records are belonging to cluster 2. Base on above table, we have updated C1 values. But corresponding to C2 updates, we have #N/A under C column. Because, corresponding to cluster 2 records under column C are distinct. No value is repeated for more the one time. So, we should not update that value.
My updated clusters are
| C1 updates | 21.4 | 22.8 | 1 | 2 |
|---|---|---|---|---|
| C2 Updates | 55 | 25.33333 | 1 | 3 |
Iteration 2: Let us update the cluster and repeat the same process.
| C1 | C2 | |||||||||||||||
|---|---|---|---|---|---|---|---|---|---|---|---|---|---|---|---|---|
| A | B | C | D | C1_T | A | B | C | D | C2_T | New_Cls | C1_T | C2_T | ||||
| A | B | C | D | 21.4 | 22.8 | 1 | 2 | 55 | 25.333 | 1 | 3 | |||||
| 10 | 22 | 1 | 1 | 129.96 | 0.64 | 0 | 1 | 12.428 | 2025 | 11.111 | 0 | 1 | 46.1 | 1 | 12.42804 | 46.12329 |
| 15 | 23 | 1 | 2 | 40.96 | 0.04 | 0 | 1 | 7.4031 | 1600 | 5.4444 | 0 | 1 | 41.1 | 1 | 7.403124 | 41.068 |
| 25 | 21 | 1 | 2 | 12.96 | 3.24 | 0 | 1 | 5.0249 | 900 | 18.778 | 0 | 1 | 31.3 | 1 | 5.024922 | 31.31135 |
| 33 | 33 | 2 | 1 | 134.56 | 104.04 | 1 | 0 | 16.447 | 484 | 58.778 | 1 | 1 | 25.3 | 1 | 16.44668 | 25.29759 |
| 45 | 35 | 2 | 2 | 556.96 | 148.84 | 1 | 1 | 28.567 | 100 | 93.444 | 1 | 1 | 15.9 | 2 | 28.5669 | 15.90843 |
| 50 | 31 | 3 | 3 | 817.96 | 67.24 | 1 | 1 | 31.752 | 25 | 32.111 | 1 | 0 | 8.56 | 2 | 31.75231 | 8.557189 |
| 24 | 15 | 2 | 2 | 6.76 | 60.84 | 1 | 1 | 10.222 | 961 | 106.78 | 1 | 1 | 34.7 | 1 | 10.22192 | 34.67687 |
| 70 | 10 | 1 | 3 | 2362 | 163.84 | 0 | 1 | 51.257 | 225 | 235.11 | 0 | 0 | 21.5 | 2 | 51.25734 | 21.4502 |
Update cluster information is shown below.
| A | B | C | D | Iter 1 | Iter 2 |
|---|---|---|---|---|---|
| 10 | 22 | 1 | 1 | 1 | 1 |
| 15 | 23 | 1 | 2 | 1 | 1 |
| 25 | 21 | 1 | 2 | 1 | 1 |
| 33 | 33 | 2 | 1 | 1 | 1 |
| 45 | 35 | 2 | 2 | 2 | 2 |
| 50 | 31 | 3 | 3 | 2 | 2 |
| 24 | 15 | 2 | 2 | 1 | 1 |
| 70 | 10 | 1 | 3 | 2 | 2 |
In the above table, we can see that there is no difference in clusters between first iteration and second iteration.
So, we can stop the process and conclude that 1,2,3,4 and 7 records belongs to first cluster. Record numbers 5,6 and 8 belongs to second cluster.
This functionality is available in R. If you want to use this functionality install a package called "clustMixType". In this package, there is a function called "kproto" hich can provide the k-prototype functionality.
library(clustMixType)
model = kproto(data,k=2)
