The federal law prohibiting sports gambling in the US was overturned by the Supreme Court in 2018. Over 30 states have since legalized the activity, with nearly two dozen also allowing online gambling (as opposed to just in person at a sportsbook within a casino). During 2021, an estimated 25% of adults bet on sports in some capacity*. With this growth in popularity, we set out to build a model to help bettors predict the outcomes of America's most popular sport: the National Football League.
We will use binary classification/supervised machine learning to predict whether the total points in an NFL game will be more or less than the total set by the oddsmakers.
As more states continue to legalize sports betting, the industry continues to grow. As such, being able to apply data analysis and machine learning to sports and betting continues to become a more valuable skillset. Along with being a marketable skill, our group are all big fans of sports, so this was a topic that piqued our interest.
- Will a given NFL game's total score go over or fall under the total set by the oddsmakers?
- Can we build a model accurate enough that a bettor who followed its results could overcome the inherent advantage sportsbooks have (also known as the "juice" or "vigorish") and be profitable over time?
- spreadspoke_scores.csv - csv file found on Kaggle containing National Football League (NFL) game results dating back to 1966 with betting odds information since 1979.
- Data obtained from Kaggle Datasets
- Cumulative DVOA csv file
- Data obtained from Football Outsiders
- Cumulative Pace csv file
- Data obtained from Football Outsiders Pace page
The dataset from Kaggle containing the game information and totals was cleaned using an r script. Playoff games and games that took place before 1993 were removed so that DVOA and Pace data from Football Outsiders could be joined and used for analysis. We also choose to remove neutral site games due to the small number of them and the outlier circumstances they take place under (Usually London or Mexico City). The final dataframe was exported as a CSV titled totals_cleaned.csv.
Yearly Data from Football Outsiders' Team DVOA and Pace Stats pages were downloaded as CSV's. Football Outsiders earned its reputation with the creation of its main statistic, DVOA, which stands for Defense-adjusted Value Over Average. From their definition of the statistic, DVOA "breaks down the entire season play-by-play, comparing success on each play to the league average based on a number of variables including down, distance, location on field, current score gap, quarter, and opponent quality." (Source)
The Yearly CSV's for DVOA were merged and cleaned using the above r script. 5 features were selected, 1 was engineered and then the final dataframe was exported as a CSV titled cumulative_dvoa. The Yearly CSV's for Pace were merged and cleaned in the above r script. 2 features were selected, 1 was engineered and then the final dataframe was exported as a CSV titled cumulative_pace.csv.
The cumulative DVOA, cumulative pace, and cleaned game data were imported into pgAdmin and joined into one dataset using postgreSQL. A number of features were engineered on the joined table and then a connection between pgAdmin and the Machine Learning Notebook was made and analysis was undertaken.
SciKitLearn is the ML library we'll be using to create our classification model that will attempt to correctly classify NFL games into hitting the over or under on their game total (as determined by betting markets). We've been testing several algorithms and comparing their results as we continue to improve and refine the dataset and model.
Tableau is one of the most widely used data analysis and visualization tools in the world today. Tableau has become almost ubiquitous in today's professional world because it gives analysts the ability to create powerful analytic dashboards that tell a clear story and can be easily shared with others. Tableau is able to take any kind of data from nearly every system, and turn it into actionable insights with speed and ease.
Please click this link to view the Google Slides draft presentation:
Please click this link to view the Tableau interactive dashboard.
Data was read into the Machine Learning model using a Jupyter notebook. Output labels were defined based on if the actual final score was higher than the Over Under Total (1 = Over, 0 = Under). Input data was preprocessed and fed into several Machine Learning Algorithms and compared based on their Accuracy Scores. In between segments of the project, the dataset was expanded. This resulted in changes to the accuracy scores of the many models we had been testing. Here are the updated scores:
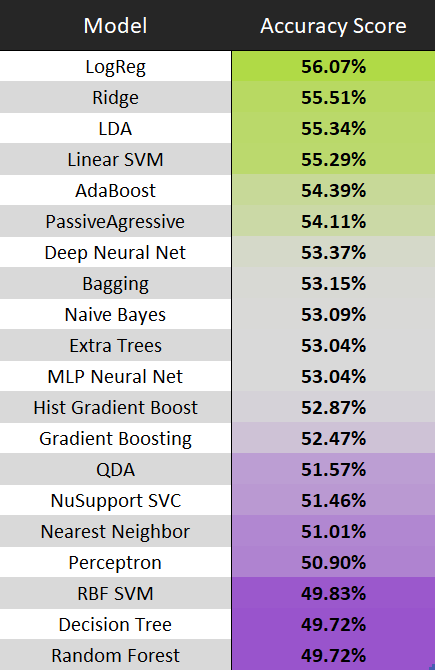
4 of the 20 models tested reached an arbitrary limit of 55% Accuracy Score. Those models were the Logistic Classifier, Ridge Classifier, Linear Discriminant Analysis Classifier, and the Linear Support Vector Machine (SVM) Classifier. The Logistic Regression Classifier produced the best results, so we will stick with that model.
The benefits of continuing to use the Logistic Regression Classifier include its ease of implementation, interpretation, and efficiency during training. Our use case also benefits from being able to easily extend the number of classes (multinomial regression). One of its limitations include its assumption of linearity between the dependent and independent variable.
The team was able to apply some of its deep knowledge and interest in NFL data when it came time to engineer and select the features to be used in the model. For instance, DVOA and pace data came with multiple columns looking at those statistics from several angles for both teams in a given matchup, including cumulative or weighted columns. In some cases, we could intuit that there was no need to ask the model to include some base features when the cumulative or weighted features already addressed them. To be certain, during segment two of the project, several suspect features were isolated and removed from the model testing and the accuracy scores were compared to the results of the model when it had included them. For results that showed no change to accuracy, or even an improvement, those features were kept out of the final model.
The data was split into training and testing sets using the Sklearn train_test_split function. By default, this function assigns 75% of the dataset to be used during the training of the model while the remaining 25% is used to test the model.
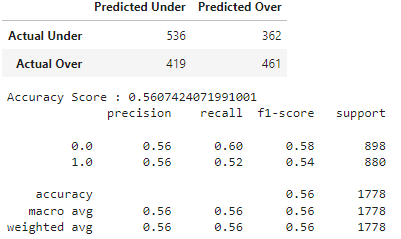
The model correctly predicted the under 536 times. An incorrect under prediction was made 419 times. It correctly predicted the over 461 times. An incorrect over prediction was made 362 times. That results in an accuracy of 56.1%.
Our model was able to show an accuracy of 56%. Per the Action Network, a prominent sports betting website, a profitable bettor must win at least 52.4% of their bets to overcome the "juice". The Action Network would consider winning at a 55% rate to be "a good year". (Source)